Don’t Confuse More Data with Better Insights — How to Streamline Your Marketing Dashboards
In today's data-driven world, more data doesn't always mean better insights. Learn how to streamline your marketing dashboards by focusing on core KPIs, ensuring data accuracy, and adopting a user-centric design. Discover practical tips for prioritizing metrics, implementing hierarchical layouts, and telling compelling stories with your data. Optimize your marketing reporting dashboard for clarity and actionability, empowering your team to make data-driven decisions confidently.

Download Presentation
Please find below an Image/Link to download the presentation.
The content on the website is provided AS IS for your information and personal use only. It may not be sold, licensed, or shared on other websites without obtaining consent from the author. Download presentation by click this link. If you encounter any issues during the download, it is possible that the publisher has removed the file from their server.
Presentation Transcript
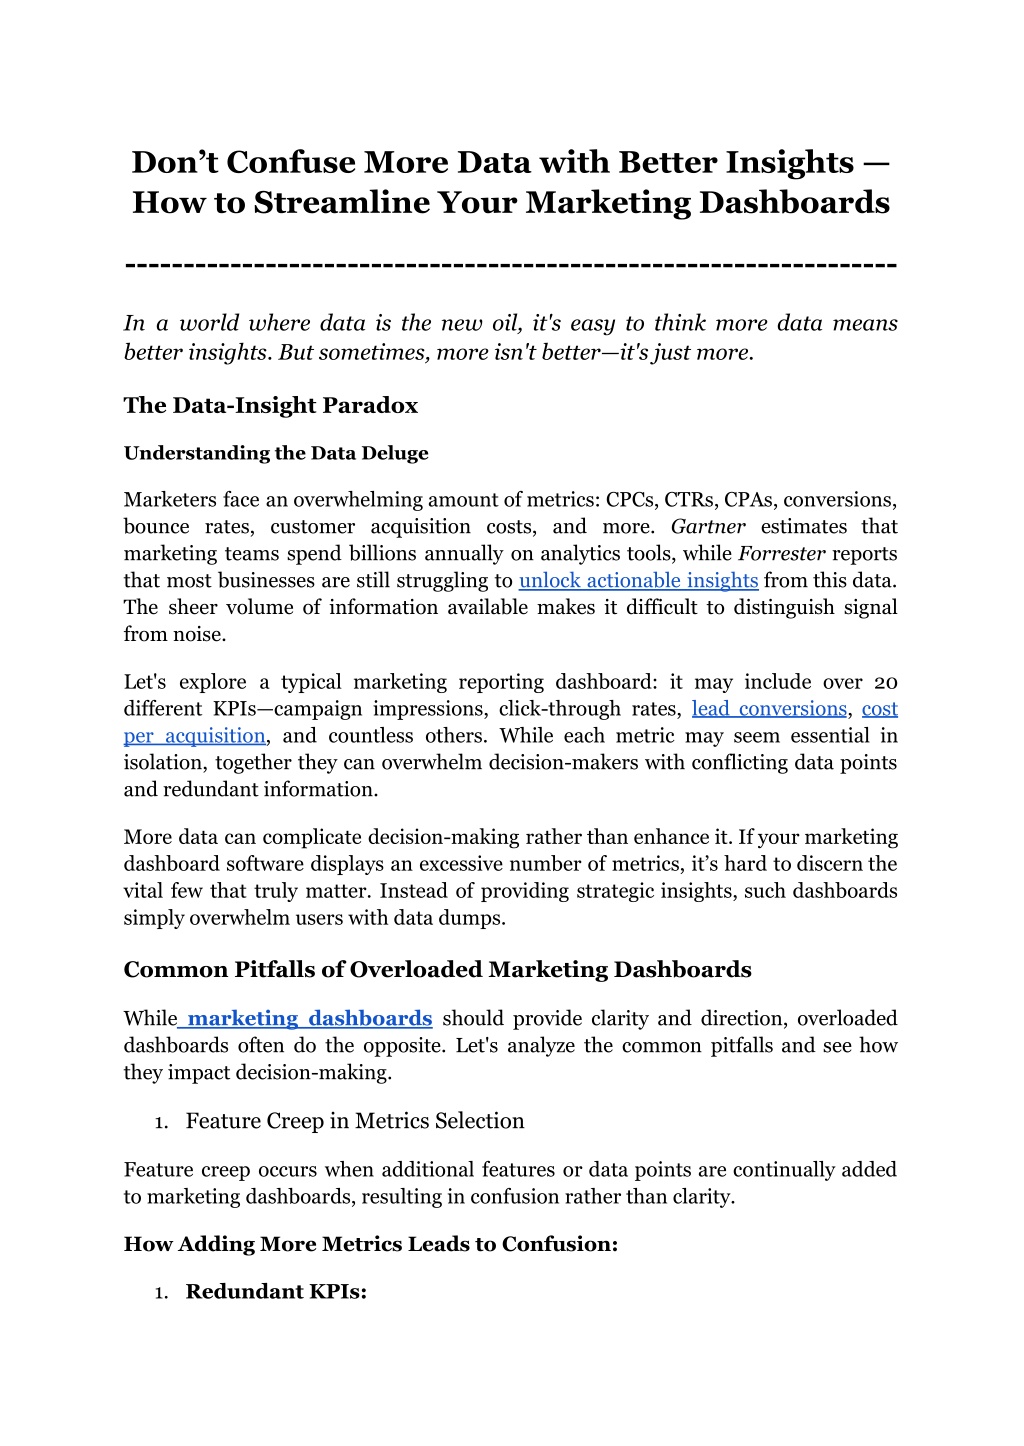
Dont Confuse More Data with Better Insights How to Streamline Your Marketing Dashboards ------------------------------------------------------------------ In a world where data is the new oil, it's easy to think more data means better insights. But sometimes, more isn't better it's just more. The Data-Insight Paradox Understanding the Data Deluge Marketers face an overwhelming amount of metrics: CPCs, CTRs, CPAs, conversions, bounce rates, customer acquisition costs, and more. Gartner estimates that marketing teams spend billions annually on analytics tools, while Forrester reports that most businesses are still struggling to unlock actionable insights from this data. The sheer volume of information available makes it difficult to distinguish signal from noise. Let's explore a typical marketing reporting dashboard: it may include over 20 different KPIs campaign impressions, click-through rates, lead conversions, cost per acquisition, and countless others. While each metric may seem essential in isolation, together they can overwhelm decision-makers with conflicting data points and redundant information. More data can complicate decision-making rather than enhance it. If your marketing dashboard software displays an excessive number of metrics, it s hard to discern the vital few that truly matter. Instead of providing strategic insights, such dashboards simply overwhelm users with data dumps. Common Pitfalls of Overloaded Marketing Dashboards While marketing dashboards should provide clarity and direction, overloaded dashboards often do the opposite. Let's analyze the common pitfalls and see how they impact decision-making. 1. Feature Creep in Metrics Selection Feature creep occurs when additional features or data points are continually added to marketing dashboards, resulting in confusion rather than clarity. How Adding More Metrics Leads to Confusion: 1. Redundant KPIs:
Multiple metrics tracking the same underlying concept create redundancy. For instance, including both Cost-per-click (CPC) and Click-through Rate (CTR) in a marketing reporting dashboard may seem comprehensive, but if not contextualized properly, it can lead to conflicting interpretations. 1. Complex Visualizations: Cramming too many data points into a single visualization makes it hard to discern patterns. Marketing dashboards filled with dense heatmaps, layered bar charts, and packed scatter plots overwhelm users with too much information at once. 1. Conflicting Data: Different data sources or variations in data extraction timing lead to discrepancies in metrics. For example, tracking revenue from both a CRM and Google Analytics could show conflicting figures due to varying attribution models. Symptoms of Feature Creep: Redundant KPIs: Tracking ROAS (Return on Ad Spend) and ROI (Return on Investment) together, despite their overlapping nature. Complex Visualizations: Bar charts layered with trend lines and comparative histograms in one view. Conflicting Data: Different results for "Total Revenue" from separate data sources. A retail marketing team added over 40 metrics to their BI dashboard software, believing each data point was essential. However, redundant KPIs like CLTV (Customer Lifetime Value) and Average Order Value (AOV) cluttered the view. Managers struggled to discern insights amidst the confusion, leading to delayed strategy adjustments and, ultimately, a 10% decline in sales. B. Decision Paralysis When marketing dashboards have too many metrics, it can overwhelm marketers and delay decisions. Decision paralysis happens when users are presented with too much information, making it hard to identify meaningful trends or actionable steps. How Too Many Metrics Overwhelm Marketers: 1. Indecision Due to Conflicting Insights: Excessive KPIs often provide conflicting signals, leading to analysis paralysis. For instance, if one campaign shows high engagement but low conversion, while another displays the opposite trend, marketing managers might hesitate on budget allocation. 1. Difficulty Prioritizing Actions:
A cluttered marketing reporting dashboard makes it difficult to prioritize actions. Should marketers focus on reducing CAC or improving CTR? The overload of data complicates such decisions. 1. Delayed Decision-Making: Overloaded marketing dashboards delay decision-making due to the time needed to analyze all data points. Suppose a SaaS company experienced decision paralysis after adding over 50 KPIs to their marketing dashboards. Conflicting data on user engagement and churn prevented the team from choosing the right marketing strategy, resulting in a missed opportunity to increase user retention. Consequently, churn increased by 12% in the following quarter. C. Lack of Storytelling Raw data, without context, fails to tell a compelling story. A well-designed BI dashboard should present data that conveys a clear narrative linking marketing performance to business outcomes. How Raw Data Fails to Tell a Compelling Story: 1. Disconnected Metrics: Metrics presented without context appear as isolated data points. For instance, CTR, Conversion Rate, and Customer Acquisition Cost (CAC) should be connected to show how they impact overall ROI. 1. No Clear Narrative: Marketing dashboards often lack a storyline explaining how campaign performance relates to broader goals. Without a narrative, even relevant KPIs like ROAS and Customer Lifetime Value (CLTV) become meaningless figures. 1. Lack of Actionable Insights: Data presented without recommendations leaves marketers guessing what steps to take next. An effective dashboard should provide not just raw data but also actionable insights. A marketing team presented a BI dashboard to their executive team with dozens of KPIs but no narrative linking the metrics to business outcomes. Executives were left confused, unable to understand how the marketing initiatives aligned with the company's strategic goals. As a result, marketing budgets were cut due to perceived inefficiencies, despite positive campaign performance.
Characteristics of Effective Marketing Dashboards Creating effective marketing dashboards requires prioritizing key metrics, ensuring data accuracy, and adopting a user-centric design. Here's how the core characteristics of impactful dashboards that can empower your marketing team. Focus on Core Objectives An effective marketing reporting dashboard must prioritize the metrics that align with your strategic goals. Instead of tracking dozens of KPIs, focus on 3-5 core metrics that provide a clear picture of performance and guide decision-making. For example, a B2B SaaS company can benefit from focusing on Customer Acquisition Cost (CAC), Customer Lifetime Value (CLTV), and Churn Rate. These three metrics offer insights into the efficiency of marketing campaigns and customer retention strategies. CAC measures the average cost to acquire a new customer, guiding budgeting decisions, while CLTV indicates the total revenue expected from a customer throughout their relationship with the business, helping identify profitable customer segments. The Churn Rate reveals the percentage of customers lost over a specific period, highlighting potential issues in customer satisfaction or product fit. By focusing on these core KPIs, a B2B SaaS company can align marketing strategies more closely with business goals, ensuring their BI dashboard delivers actionable insights. Data Hygiene and Accuracy A marketing reporting dashboard is only as good as the data it presents. Cleansing, deduping, and validating marketing data are crucial to ensuring the insights derived from the dashboard are accurate and actionable. Duplicate leads can inflate lead counts and skew conversion metrics, resulting in overestimated campaign effectiveness. Data inconsistencies, such as different naming conventions across marketing platforms, can lead to inconsistent tracking and reporting, while outdated data might lead to incorrect assumptions about current customer behavior and market trends. To ensure data hygiene, regularly dedupe your lead data across different marketing channels, implement consistent naming conventions for campaigns, channels, and customer segments, and automate data validation through ETL (Extract, Transform, Load) processes to maintain accuracy. User-Centric Design Principles
Marketing dashboards must be tailored to their end users: marketers, analysts, and executives. Each group has unique needs, and a one-size-fits-all approach won't provide optimal value. For marketers, who need tactical metrics like campaign performance and lead quality to optimize their marketing strategies, a clear marketing reporting dashboard should prioritize KPIs like Conversion Rates, Cost per Acquisition (CPA), and Lead Quality Score. Analysts require operational metrics for deeper analysis, such as click-through rates, open rates, and engagement metrics. A BI dashboard for analysts can use detailed tables, heatmaps, and scatter plots to visualize campaign data. Executives seek high-level strategic insights to evaluate the overall impact of marketing efforts on business growth, so marketing dashboards for executives should highlight strategic KPIs like ROI, CLTV, and Market Share with concise summaries. Adopting simplicity, clarity, and a goal-oriented approach, dashboards should be structured hierarchically, starting with strategic KPIs at the top, followed by tactical and operational metrics. Consistent color schemes and visualization types across all marketing dashboards improve readability, while filters and drill-down capabilities provide users with interactive tools to explore specific data points in more detail. Streamlining Marketing Dashboards for Better Insights In an era of data overload, streamlining marketing dashboards is crucial for uncovering actionable insights and driving business success. By understanding the audience, prioritizing relevant KPIs, and adopting effective visualization techniques, you can create a marketing reporting dashboard that delivers meaningful information for faster decision-making. Define Your Audience and Goals To create an effective BI dashboard, it's essential to understand the audience and their specific goals. A marketing dashboard designed for C-suite executives, marketing managers, and analysts should cater to each group s unique needs: C-suite Executives: Require high-level strategic insights to evaluate overall marketing impact on business growth. They need to see strategic KPIs like ROI, Customer Lifetime Value (CLTV), and Market Share. Marketing Managers: Focus on tactical metrics to optimize campaign performance, such as Conversion Rates, Lead Quality, and Customer Acquisition Cost (CAC).
Analysts: Prefer granular operational data like click-through rates, open rates, and engagement metrics to perform deeper analysis. Establishing what each audience needs to see helps design dashboards that empower faster and more accurate decision-making. KPI Selection and Prioritization Selecting and prioritizing KPIs is crucial to building effective marketing dashboards. Frameworks like SMART (Specific, Measurable, Achievable, Relevant, Time-bound) and ICE (Impact, Confidence, Ease) provide structured approaches to choosing the most relevant metrics. Categorizing KPIs: Strategic KPIs: Align with business goals and give a high-level overview (e.g., ROI, CLTV, Market Share). Tactical Metrics: Reflect marketing performance (e.g., Conversion Rates, Lead Quality, CAC). Operational Metrics: Offer day-to-day campaign insights (e.g., click-through rates, bounce rates, open rates). Examples of Strategic, Tactical, and Operational KPIs: Strategic: ROI, CLTV, Market Share. Tactical: Conversion Rates, CAC, Lead Quality Score. Operational: CTR (Click-through Rate), Open Rates, Bounce Rates. By categorizing KPIs into strategic, tactical, and operational groups, you can design a marketing reporting dashboard that helps marketers, analysts, and executives quickly find the information they need. Implementing a Hierarchical Layout A hierarchical layout ensures that top-level insights are presented first, with users able to drill down into granular details as needed. This structure helps marketers focus on the most important information upfront while providing additional context through detailed data points. Example Layout: 1. Executive Summary (Strategic KPIs): ROI, CLTV, Market Share. 2. Marketing Performance Overview (Tactical Metrics): Conversion Rates, Lead Quality Score, CAC. 3. Campaign-Level Insights (Operational Metrics): CTR, Open Rates, Bounce Rates.
A well-designed hierarchical layout ensures that marketing dashboards provide comprehensive yet digestible insights. 4. Visualization Techniques for Clarity Choosing the right visualization techniques is crucial for simplifying complex data and improving the clarity of marketing dashboards. Different types of charts, graphs, and tables can communicate key insights effectively. Let s look at some optimal Visualization Techniques: Graphs & Charts: Heatmaps: Highlight variations in campaign performance or customer engagement. Bullet Charts: Compare KPIs against benchmarks. Sparklines: Show trends over time in minimal space. Tables: Provide granular campaign data for analysts and managers. Use conditional formatting (color coding) to highlight significant changes. By selecting the right visualization techniques, marketing reporting dashboards can deliver clear and concise insights that drive decision-making. 5. Storytelling with Data Crafting a compelling narrative around KPIs is essential for connecting data to marketing goals and outcomes. Rather than presenting raw data, marketing dashboards should provide actionable insights that help users understand the impact of their marketing strategies. Tips for Effective Storytelling with Data: 1. Define the Narrative: Establish a clear storyline linking KPIs to marketing goals (e.g., how increasing ad spend boosted ROI by 20%). 2. Use Contextual Information: Highlight external factors (e.g., seasonality, competitor actions) that impact marketing performance. 3. Provide Actionable Insights: Recommend specific actions based on the data (e.g., "Increase ad spend on Campaign X to improve ROI by 15%"). By combining storytelling with visualization techniques, marketing dashboards can transform data into meaningful narratives that empower teams to take action. Conclusion
In the quest to optimize marketing performance, it's easy to fall into the trap of overloading your marketing dashboards with data. However, more data doesn't necessarily lead to better insights. Instead, focus on streamlining your dashboards by prioritizing core KPIs that align with strategic goals, ensuring data hygiene, and adopting user-centric design principles. Effective marketing dashboards should deliver clarity and direction. By defining your audience, selecting the most relevant KPIs, and crafting a hierarchical layout, your marketing reporting dashboard can provide actionable insights that empower marketers, analysts, and executives to make data-driven decisions confidently. Interested in streamlining your marketing dashboards with a powerful BI dashboard solution? Try Grow dashboard software and experience the difference. With an intuitive interface, customizable dashboards, and robust visualization techniques, Grow makes it easy to turn data into meaningful insights. Sign up for a 14-day free demo and discover why "Grow Reviews 2024" consistently praises its ability to transform data-driven decision-making. Ready to get started? Start your 14-day free demo today.