Understanding Fossil Fuels, Energy, and the Carbon Cycle

Exploring the relationship between fossil fuels, energy production, and carbon emissions. Learn about the carbon cycle, photosynthesis, and the impact of human activities on the environment. Delve into the extraction of hydrocarbons, coal mining, and personal experiences in petroleum production. Gain insights into the significance of hydraulic fracturing in energy extraction processes.

Uploaded on Oct 02, 2024 | 0 Views
Download Presentation

Please find below an Image/Link to download the presentation.
The content on the website is provided AS IS for your information and personal use only. It may not be sold, licensed, or shared on other websites without obtaining consent from the author. Download presentation by click this link. If you encounter any issues during the download, it is possible that the publisher has removed the file from their server.
E N D
Presentation Transcript
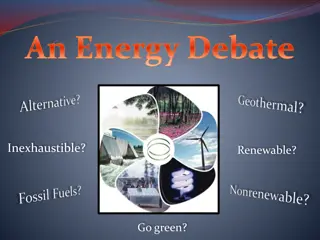
Fossil Fuels Fossil Fuels & Energy & Energy
All the data is shown in GtC 1 Gigatonne (Gt) = 1 billion tonnes = 1 1015g = 1 Petagram (Pg) 1 kg carbon (C) = 3.664 kg carbon dioxide (CO2) 1 GtC = 3.664 billion tonnes CO2 = 3.664 GtCO2 Disclaimer The Global Carbon Budget and the information presented here are intended for those interested in learning about the carbon cycle, and how human activities are changing it. The information contained herein is provided as a public service, with the understanding that the Global Carbon Project team make no warranties, either expressed or implied, concerning the accuracy, completeness, reliability, or suitability of the information.
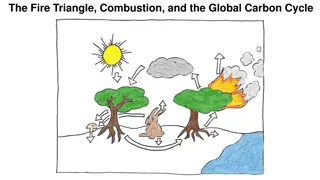
Carbon, Life, and Energy Carbon, Life, and Energy Photosynthesis uses energy from the sun to convert inorganic air convert inorganic air (CO (CO2 2) to living biomass! ) to living biomass! Most of this energy is released through respiration (back to CO2) when plants are eaten by animals, bacteria, people
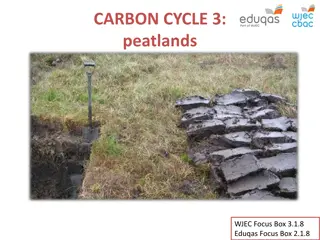
Fossil Fuels Fossil Fuels Some of the stored solar energy in biomass can be preserved in fossilized remains
Hydrocarbons, Energy, and CO Hydrocarbons, Energy, and CO2 2 H H H H C C C C H H C C C C H H H H We dig this stuff ( fossil fuels ) up and burn it harvesting the stored energy harvesting the stored energy to power civilization burn it, O C C H H O C C H H H H H H
Mining Coal Mining Coal
On a Personal Note On a Personal Note Scott Petroleum production is extremely dangerous work! I was a wellsite geologist long ago I lived and worked on oil rigs for a year
Hydraulic Fracturing Hydraulic Fracturing
Shale Gas from Fracking in the USA Shale Gas from Fracking in the USA
Changes in US Energy Changes in US Energy Consumption Consumption Wood then Coal then Oil then Gas then Nuclear then Renewables
The Kaya Identity The Kaya Identity Four factors determine Four factors determine future emissions: future emissions: Population Economic activity Energy efficiency of economy Carbon efficiency of energy
Billions and Billions Billions and Billions Shanghai 1991 and 2012 Shanghai 1991 and 2012 Currently 7 billion people on Earth but only 1 billion use lots of energy Rapid development to 4 billion energy users over coming decades Population growth only 30% but energy growth 300% by 2100
Population Population
2014 Population Growth Rates 2014 Population Growth Rates USA = +0.77 %/yr Definition: The average annual percent change in the population, resulting from a surplus (or deficit) of births over deaths and the balance of migrants entering and leaving a country. The rate may be positive or negative. The growth rate is a factor in determining how great a burden would be imposed on a country by the changing needs of its people for infrastructure (e.g., schools, hospitals, housing, roads), resources (e.g., food, water, electricity), and jobs. Rapid population growth can be seen as threatening by neighboring countries. Source: CIA World Factbook - Unless otherwise noted, information in this page is accurate as of January 1, 2014
GDP/ GDP/ Population Population Luxembourg-10.27x world United states- 5.02x world http://statisticstimes.com/economy/world-gdp-capita-ranking.php Source: International Monetary Fund World Economic Outlook
Energy/GDP Energy/GDP The energy intensity required to produce a unit of GDP is falling in most countries of the world China GDP grew by about 10% a year between 1980 and 2005, while energy use grew by a little less than 6% per year Between 2005 and 2010, real GDP continued to grow by about 10% per year, while energy use grew by about 7.5% per year Up until 2005, the USA was able to increase real GDP by 3% per year, while increasing energy use by only 1% per year
CO2/Energy CO2/Energy lbs. CO2e/kWh Natural Gas: 0.6-2 Coal: 1.4-3.6 lbs. Wind 0.02 to 0.04 Solar 0.07 to 0.2 Geothermal 0.1 to 0.2 Source: IPCC, 2011: IPCC Special Report on Renewable Energy Sources and Climate Change Mitigation
Kaya Components Kaya Components Rich Countries Poor Countries $ CO2 $ pop CO2 pop kWhr/$ kWhr/$ CO2 emissions almost tripled +137% GDP/population +42% population growth C intensity increase due to increased Coal use TPES (Total Primary Energy Supply) CO2 emissions: 6% lower in 2013 than 1990 Carbon intensity: declined 8*
Components of Emissions Growth Developing world: Economic growth dominates kWhr/$ $/person Developed world: Energy efficiency dominates https://www.iea.org/publications/freepublications/publication/CO2EmissionsFro mFuelCombustionHighlights2015.pdf
Case Study: United States Case Study: United States - CO2/Energy Consumption is 8.2% lower than 1990 levels - Energy Consumption and CO2/GDP - Shift from a manufacturing economy to a service-based economy, increases in efficiency, energy consumption and energy-related CO2 emissions per dollar of gross domestic product (GDP) have both declined since 1990 energy/$ down by 35% https://www3.epa.gov/climatechange/Downloads/ghgemissions/US-GHG- Inventory-2016-Chapter-3-Energy.pdf
Emissions from fossil fuel use and industry Global emissions from fossil fuel and industry: 36.3 1.8 GtCO2 in 2015, 63% over 1990 Projection for 2016: 36.4 2.3 GtCO2, 0.2% higher than 2015 Uncertainty is 5% for one standard deviation (IPCC likely range) Estimates for 2014 and 2015 are preliminary. Growth rate is adjusted for the leap year in 2016. Source: CDIAC; Le Qu r et al 2016; Global Carbon Budget 2016
Observed emissions and emissions scenarios The emission pledges to the Paris Agreement avoid the worst effects of climate change (4-5 C) Most studies suggest the pledges give a likely temperature increase of about 3 C in 2100 Negative emissions! The IPCC Fifth Assessment Report assessed about 1200 scenarios with detailed climate modelling on four Representative Concentration Pathways (RCPs) Source: Fuss et al 2014; CDIAC; IIASA AR5 Scenario Database; Global Carbon Budget 2016
Top emitters: fossil fuels and industry (absolute) The top four emitters in 2015 covered 59% of global emissions China (29%), United States (15%), EU28 (10%), India (6%) Bunker fuels are used for international transport is 3.1% of global emissions. Statistical differences between the global estimates and sum of national totals are 1.2% of global emissions. Source: CDIAC; Le Qu r et al 2016; Global Carbon Budget 2016
Top emitters: fossil fuels and industry (per dollar) Emissions per unit economic output (emissions intensities) generally decline over time China s intensity is declining rapidly, but is still much higher than the world average GDP are measured in purchasing power parity (PPP) terms in 2005 dollars. Source: CDIAC; IEA 2015 GDP to 2013, IMF 2016 growth rates to 2015; Le Qu r et al 2016; Global Carbon Budget 2016
Emissions from coal, oil, gas, cement Share of global emissions in 2015: coal (41%), oil (34%), gas (19%), cement (6%), flaring (1%, not shown) Source: CDIAC; Le Qu r et al 2016; Global Carbon Budget 2016
Historical cumulative emissions by country Cumulative emissions from fossil-fuel and cement were distributed (1870 2015): USA (26%), EU28 (23%), China (13%), Russia (7%), Japan (4%) and India (3%) Cumulative emissions (1990 2015) were distributed China (21%), USA (20%), EU28 (14%), Russia (6%), India/Japan (4%) All others includes all other countries along with bunker fuels and statistical differences Source: CDIAC; Le Qu r et al 2016; Global Carbon Budget 2016
Carbon intensity of economic activity Global emissions growth has generally recovered quickly from previous financial crises It is unclear if the recent slowdown in global emissions is related to the Global Financial Crisis Economic activity is measured in Purchasing Power Parity Source: CDIAC; Peters et al 2012; Le Qu r et al 2016; Global Carbon Budget 2016
Emissions per capita The 10 most populous countries span a wide range of development and emissions per person Emission per capita: CO2 emissions from fossil fuel and industry divided by population Source: Global Carbon Budget 2016
Major flows from production to consumption Flows from location of generation of emissions to location of consumption of goods and services Huge transfer of emissions from China to support consumpti on in rich countries! Values for 2011. EU is treated as one region. Units: MtCO2 Source: Peters et al 2012
Total global emissions Total global emissions: 41.9 2.8 GtCO2 in 2015, 49% over 1990 Percentage land-use change: 36% in 1960, 9% averaged 2006-2015 Emissions from FF are 10x those from deforestation Three different methods have been used to estimate land-use change emissions, indicated here by different shades of grey Source: CDIAC; Houghton et al 2012; Giglio et al 2013; Le Qu r et al 2016; Global Carbon Budget 2016
Global carbon budget The carbon sources from fossil fuels, industry, and land use change emissions are balanced by the atmosphere and carbon sinks on land and in the ocean 10% of emissions of emissions of emissions of emissions Source: CDIAC; NOAA-ESRL; Houghton et al 2012; Giglio et al 2013; Joos et al 2013; Khatiwala et al 2013; Le Qu r et al 2016; Global Carbon Budget 2016
Cumulative global CO2 emissions and temperature Cumulative global CO2 emissions from fossil fuels, industry, and land use change and four simplified future pathways compared to probability of exceeding different temperatures The green boxes show the year that the exceedance budgets are exceeded assuming constant 2016 emission levels The years are indicative and vary depending on definition and methodology Source: Jackson et al 2015b; Global Carbon Budget 2016
The emission pledges (INDCs) of the top-4 emitters The emission pledges compared to different ways of sharing the remaining 2 C quota Equity: Remaining quota shared by current population. Inertia: The remaining quota shared by current emissions. Source: Peters et al 2015; Global Carbon Budget 2016
The emission pledges (INDCs) of the top-4 emitters The emission pledges from the US, EU, China, and India leave no room for other countries to emit in a 2 C emission budget (66% chance) Source: Peters et al 2015; Global Carbon Budget 2016
Negative emissions required for 2 C To achieve net-negative emissions globally after 2050 requires deployment as early as 2020-2030 If negative emission technologies do not work at scale, society is locked into higher temperatures Source: Anderson & Peters 2016


")
")


 of the top-4 emitters")
 of the top-4 emitters")