Implementation of Pupil Equity Funding at Lundavra Primary
Lundavra Primary in Fort William, opened in 2015, amalgamated from three schools, serves a diverse student population with 15% on free school meals and 19% living in SIMD 2 areas. The implementation process involves identifying gaps through data tracking, analyzing pupil equity data, and addressing attainment disparities in Maths, Reading, and Writing. The school also focuses on attendance, additional support needs, and English as an Additional Language (EAL) to ensure all students receive necessary support.

Download Presentation

Please find below an Image/Link to download the presentation.
The content on the website is provided AS IS for your information and personal use only. It may not be sold, licensed, or shared on other websites without obtaining consent from the author. Download presentation by click this link. If you encounter any issues during the download, it is possible that the publisher has removed the file from their server.
E N D
Presentation Transcript
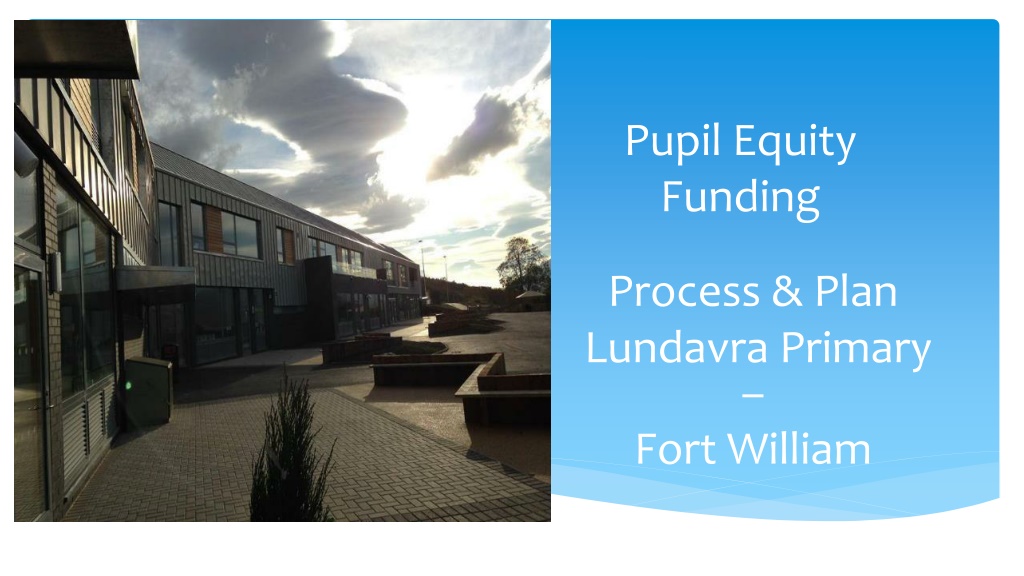
Pupil Equity Funding Process & Plan Lundavra Primary Fort William
Lundavra Primary New build school - opened August 2015 Amalgamation of three existing schools 11 classroom school and large Nursery Serves the Fort William town area 15% of school on Free school meals 19% living in an area in SIMD 2 31% of school roll either FSM or in SIMD 2 25% of learners have English as an additional language
Identifying the gap at Lundavra 1. 2. Identify FSM pupils Look at other groups identified as living in deprivation we have large number of pupils living in SIMD 2 Collect all the data we have onto one Pupil Equity tracker On SEEMis migrate data for FSM s, SIMD 2 pupils. We included: Attendance EAL ASN/ Stage Looked after SIMD/ FSM We then added standardised scores for P3,5 and 7 s and teacher judgements of progress/attainment 3.
Identifying the gap at Lundavra Analysis of Pupil Equity Data February 2017 FSM = 39 pupils, 17% of school roll SIMD 2 (the lowest quintile) = 31 more pupils 31% of school roll in total.
Attainment gap SPP June 2017 Maths 52% of FSM/SIMD 2 working at or above expected level School average 2016 = 55% Gap between FSM/SIMD 2 and whole school = 3% points Reading 50% of FSM/SIMD 2 working at or above expected level School average 2016 = 59% Gap between FSM/SIMD 2 and whole school = 9% points Writing 44% working at or above expected level School average 2016 = 60% Gap between FSM/SIMD 2 and whole school = 16% points
Attendance Whole school average = 93.75% FSM + SIDM 2 pupils attendance = 90.5% Additional Support Needs and EAL 49% of FSM/SIMD 2 pupils have identified ASN compared to 33% whole school 25% of FSM/SIMD 2 pupils have EAL - in line with whole school figure Adverse individual circumstances High incidence of adverse factors identified within this group
Collegiate Improvement Planning with staff What are the barriers to learning for these pupils? Identified barriers 1. Low attendance of identified pupil group 2. High levels of identified ASN within target group, 3. No s of EAL pupils and language levels impacting on literacy attainment 4. High incidence of adverse factors identified within this group 5. Maths progress and understanding across the school
Have a go at auditing your own school provision in one of these 12 areas, is it working? how do you know?
What do we do next.? Within class? Outside of class? Discuss, suggest, innovate Consult staff, parents, pupils, associated schools group Evidence of success? Resources to help https://education.gov.scot/improvement/Pages/Interventions-for- Equity.aspx https://educationendowmentfoundation.org.uk/resources/teaching- learning-toolkit
Focus on selected targeted interventions 1. Create new role to focus on supporting pupils and families with key focus on: Preparing children s readiness for school and learning Raising attendance and punctuality Parental engagement/ family learning Nurture groups P1-3 s Employ additional EAL support with key focus on supporting Emerging Literacy programme/ staff/ families Develop the use of Maths Recovery within the school Free up trained member of staff to work with pupils /staff in delivering interventions 2. 3.
Lundavra Primary School: Closing the Gap and Raising Attainment Plan 2017-18 What data/evidence informs this priority? targets/ % 17/18, 18/19, 19/20 Attendance for FSM/SIMD 2 pupils is 3.25% lower than the school average 38% of target group have CCF much higher than school average Identified group of P1-3 children, mainly boys, requiring intensive support. and parents Interventions Expected Impact Measures Actual Impact Outcomes (detail Improve attendance and narrow the gap to 2% by June 18 Develop targeted out of school support for pupils Create new role of Children s Services Worker to focus on supporting pupils and families (PEF Funded) Weekly/ termly/ annual celebration of attendance and targets set. CSW support to parents Daily Breakfast Club free to target group (PEF Funded) After-school Youth Club for P1-7 s free/reduced price to target group Whole school parental involvement strategy Nurture group in place to target identified P1 3 pupils and families requiring support Nurturing for All professional learning to be delivered to whole staff Increase whole school attendance figure to 94% Reduce the gap between whole school average and target group to 2% Increase target group participation in Breakfast club and After school clubs to match or be above their school ratio of 30% All classes to hold at least one parental engagement in class event a term Pupils to develop identified individual skills Raise staff awareness and understanding of nurture and attachment, impact of ACE on learning/ achievement Weekly monitoring and celebration of attendance rate of whole school and focus groups/individuals Monitoring of participation in Breakfast club, Youth Club, parental activities for target groups and school Parental feedback and evaluations following visits Boxall profiles in place Weekly monitoring of nurture targets Staff Questionnaires from Nurture for All At end of Term 2: Whole school = 94.5% Target Group = 92.6 A 1.9% gap BC Review Meeting Dec 2017: FSM pupil participation at BC now exceeds non FSM rate At end of Term 2YC participation is excellent, averaging about 40 children per session, about 40% of whom are target group 1st Steps Reading Together Evaluations very +ve All classes held termly events Parent Events Group established