Understanding Effects of Sexual Conflict on Female Longevity in Drosophila
Exploring the impact of male ejaculate protein on the lifespan of mated female Drosophila by analyzing egg production, fertility, mating costs, and the interaction between different treatments. Results suggest that fertile and sterile females, as well as those exposed to high-cost vs. low-cost males, exhibit varied longevity patterns based on egg production and mating frequency. The study utilized a 2-Factor GLM analysis to evaluate these factors and their effects on female lifespan.

Download Presentation

Please find below an Image/Link to download the presentation.
The content on the website is provided AS IS for your information and personal use only. It may not be sold, licensed, or shared on other websites without obtaining consent from the author. Download presentation by click this link. If you encounter any issues during the download, it is possible that the publisher has removed the file from their server.
E N D
Presentation Transcript
Sexual conflict Focus: Interpreting Main effects when interaction absent 1
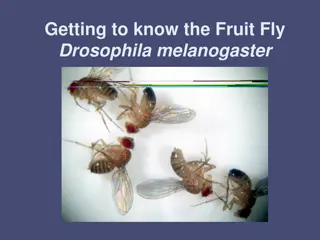
Another example (Whitlock and Schluters text, Ch. 18) Ejaculate of male Drosophila produce a protein (called SP) that reduces the lifespan of mated females. How? One possibility: SP causes females to produce more eggs, and this extra effort reduces lifespan Females fertile sterile (no eggs) high-cost to females (frequent mating) 210 210 Measured female longevity (in days) Males 210 212 low-cost (infrequent mating) NOTE: these are sample sizes for treatment combinations 3 Photo: Darren Obbard
Lets think before we analyze If producing more eggs reduces longevity, do we expect fertile and sterile females have similar longevity? If mating, per se, is costly to females, do we expect similar lifespan for females exposed to high- vs. low-cost males? If SP increases egg production (and lowers longevity), do we expect high- & low- cost males to affect lifespan of fertile & sterile females similarly? Females fertile sterile (no eggs) high-cost to females (frequent mating) 210 210 Measured female longevity (in days) Males 210 212 low-cost (infrequent mating) NOTE: these are sample sizes for treatment combinations 4
Lets think before we analyze If producing more eggs reduces longevity, do we expect fertile and sterile females have similar longevity? No; sterile > fertile If mating, per se, is costly to females, do we expect similar lifespan for females exposed to high- vs. low-cost males? No; low-cost > high-cost If SP increases egg production (and lowers longevity), do we expect high- & low- cost males to affect lifespan of fertile & sterile females similarly? No; we expect high- vs. low-cost males to affect lifespan of fertile females, but not sterile females (SP cannot increase their egg production). Females fertile sterile (no eggs) high-cost to females (frequent mating) 210 210 Measured female longevity (in days) Males 210 212 low-cost (infrequent mating) NOTE: these are sample sizes for treatment combinations 5
Reporting the results We analyzed our data with a 2-Factor GLM, accounting for unbalanced data (type 3 sum of squares). 50 40 Lifespan (days) 30 Effects of Fertility appear consistent across levels of Treatment, and vice versa (2-Factor GLM; interaction term, F1,838= 0.36, p = 0.55). 20 10 0 high-cost.fertile low-cost.fertile high-cost.sterile low-cost.sterile On average, females in the low-cost treatment lived 6.98 days (SE = 0.57; 95% CIs: 5.86-8.09) longer than females in the high-cost treatment (marginal mean SE; 31.2 0.4 and 24.2 0.4 days, respectively; Figure 1) (2-Factor GLM; Treatment term, F1,838=150.5, p < 2.2 * 10-16). Figure 1: Boxplots and values of individual female flies (points) depicting female lifespan (days) in a 2-factor experiment that manipulated female fertility and costliness of male. Thick lines show median values; long, thin horizontal lines indicate 25% and 75% quartiles. Sterile females lived 2.18 (SE = 0.57; 95% CIs: 1.06-3.30) days longer than fertile females (28.8 0.4 and 26.6 0.4, respectively; Figure 1; F1,838=14.7, p = 0.00013). 7


")