TV Viewing Trends: Shifting Dynamics and Stable Landscapes
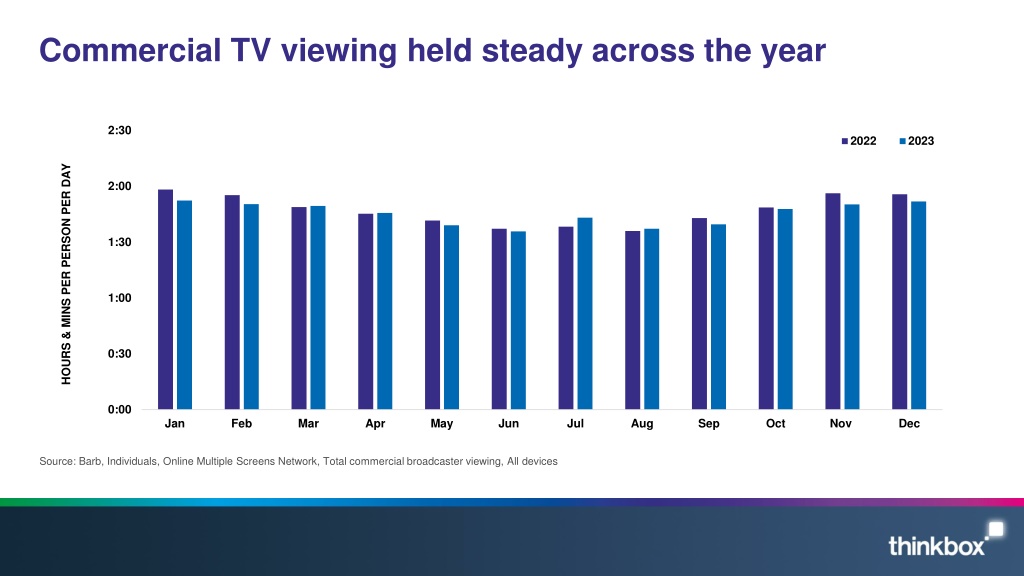
TV viewing patterns in 2022 and 2023 show interesting trends. While commercial TV viewing remained steady throughout the year, there was a drop in 16-34 age group viewing in Q4 2023 due to the absence of the Men's Football World Cup. The shift from linear TV to Video on Demand (VOD) is continuing, with a particularly noticeable change among young audiences. Overall, the TV viewing landscape is becoming more stable with some fluctuation in different demographics.

Download Presentation

Please find below an Image/Link to download the presentation.
The content on the website is provided AS IS for your information and personal use only. It may not be sold, licensed, or shared on other websites without obtaining consent from the author. Download presentation by click this link. If you encounter any issues during the download, it is possible that the publisher has removed the file from their server.
E N D
Presentation Transcript
Commercial TV viewing held steady across the year 2:30 2022 2023 HOURS & MINS PER PERSON PER DAY 2:00 1:30 1:00 0:30 0:00 Jan Feb Mar Apr May Jun Jul Aug Sep Oct Nov Dec Source: Barb, Individuals, Online Multiple Screens Network, Total commercial broadcaster viewing, All devices
16-34 viewing dropped in Q4 2023 due to no Mens Football World Cup 1:00 2022 2023 HOURS & MINS PER PERSON PER DAY 0:30 0:00 Jan Feb Mar Apr May Jun Jul Aug Sep Oct Nov Dec YoY Change: -7.4% Source: Barb, 16-34, Online Multiple Screens Network, Total commercial broadcaster viewing, All devices
The gradual shift of viewing from linear to VOD continues All Adults -6% 3:00 2022 2023 2:30 2:00 1:30 +12% 1:00 +5% +23% 0:30 +23% 0:00 Linear TV BVOD SVOD YouTube TikTok Source: Barb, Thinkbox video day analysis, All devices, Includes estimates for OOH viewing to TikTok and YouTube (ViewersLogic)
This trend is more exaggerated for young audiences 16-34s 1:30 2022 2023 +8% +5% -12% 1:00 +17% 0:30 +16% 0:00 Linear TV BVOD SVOD YouTube TikTok Source: Barb, Thinkbox video day analysis, All devices, includes estimates for OOH viewing to TikTok and YouTube (Viewers Logic)
Overall, its a much more stable viewing landscape 6:00 5:30 5:00 HOURS PER PERSON PER DAY (Adults) 4:30 TikTok YouTube Other online video Cinema DVD SVOD Broadcaster TV 4:00 3:30 3:00 2:30 2:00 1:30 1:00 0:30 0:00 2015 2016 2017 2018 2019 2020 2021 2022 2023 Source: IPA TouchPoints, Adults, Barb, All devices, Includes estimates for OOH viewing to TikTok and YouTube
Broadcaster TV viewing amongst 16-34s is stabilising 5:00 4:30 HOURS PER PERSON PER DAY (16-34s) 4:00 TikTok YouTube Other online video Cinema DVD SVOD Broadcaster TV 3:30 3:00 2:30 2:00 1:30 1:00 0:30 0:00 2015 2016 2017 2018 2019 2020 2021 2022 2023 Source: IPA TouchPoints, 16-34, Barb, All devices, Includes estimates for OOH viewing to TikTok and YouTube
SVOD subscriptions marginally dipped last year 20 18 MILLIONS OF HH 16 14 12 Amazon Apple TV+ Disney+ Netflix Other SVOD Any SVOD 10 8 6 4 2 0 Q4 2014 Q4 2015 Q4 2016 Q4 2017 Q4 2018 Q4 2019 Q3 2020* Q4 2021 Q4 2022 Q4 2023 Source: Barb Establishment Survey - number of households * = Due to the COVID-19 pandemic and the suspension of face-to-face interviewing, quarterly Barb Establishment Survey data were not produced for Q4 2020, as a result, 2020 Q3 data is used
The TV set remains the home for viewing to high-quality content 0.1% 0.2% 0.4% TV set viewing time by platform 2023, All Adults 5% 3% YouTube 3% Other AVOD/SVOD 8% Apple TV+ Paramount + 9% 3hrs 34 mins PER DAY Amazon Disney+ Netflix 71% Broadcaster VOD Linear TV Source: Barb
The TV set remains the home for viewing to high-quality content 0.2% 0.4% 0.6% TV set viewing time by platform 2023, 16-64 7% 4% YouTube Other AVOD/SVOD 5% Apple TV+ Paramount + 12% 2hrs 56 mins PER DAY Amazon Disney+ 60% Netflix 11% Broadcaster VOD Linear TV Source: Barb
TV is the shared medium 60% 50% % OF VIEWING THAT IS CO-VIEWING 50% 44% 43% 42% 40% 30% 20% 10% 10% 0% Live Playback BVOD SVOD YouTube Source: Barb / TRP / 2023 / All devices
VOD is enabling us to watch more drama, entertainment & film Entertainment (23) Entertainment Entertainment (22) Drama (23) Drama Drama (22) News/Weather (23) News News/Weather (22) Sport Sport (23) Sport (22) Documentaries (23) Documentaries Linear BVOD SVOD Documentaries (22) Hobbies/Leisure (23) Hobbies Hobbies/Leisure (22) Films (23) Films Films (22) Current Affairs (23) Current Affairs Current Affairs (22) Children (23) Children Children (22) Music (23) Music Music (22) 0 5 10 15 20 25 30 35 40 MINUTES PER PERSON PER DAY Source: Barb - TV set only, Individuals
Among 16-34s, VOD is critical for several genres Entertainment (23) Entertainment (22) Entertainment Drama (23) Drama (22) Drama News/Weather (23) News/Weather (22) News Sport (23) Sport (22) Sport Documentaries (23) Documentaries (22) Documentaries Hobbies/Leisure (23) Hobbies/Leisure (22) Hobbies Films (23) Films (22) Films Current Affairs (23) Current Affairs (22) Current Affairs Linear BVOD SVOD Children (23) Children (22) Children Music (23) Music (22) Music 0 5 10 15 20 25 30 MINUTES PER PERSON PER DAY Source: Barb - TV set only, 16-34s
16-34s have an affinity for entertainment, drama and films % of All Viewing Genre Individuals 16-34s Index Entertainment 23% 30% 129 Drama 20% 23% 119 Films 11% 14% 136 Sport 9% 9% 100 Children 4% 7% 184 Documentaries 11% 7% 61 News/Weather 10% 3% 33 Hobbies/Leisure 7% 3% 43 Current Affairs 3% 1% 44 Music 1% 1% 98 Source: Barb 2023, % of all viewing, index vs individuals.
UK original content dominates the top 30 series of 2023 Top 30 series on UK Television 2023 (All Inds 4+, TV set viewing only) Rank Channel Title 1 BBC Happy Valley 2 CH4 The Great British Bake Off 3 BBC Strictly Come Dancing 4 BBC Death in Paradise 5 ITV I'm a Celebrity... Get Me Out of Here! 6 BBC Wild Isles 7 BBC Beyond Paradise 8 Amazon Clarkson's Farm 9 ITV Unforgotten 10 BBC Planet Earth III 11 BBC Call the Midwife 12 BBC Silent Witness 13 BBC The Apprentice 14 ITV The 1% Club 15 BBC Vigil Top 30 series on UK Television 2023 (All Inds 4+, TV set viewing only) Rank Channel Title 16 BBC The Sixth Commandment 17 BBC Shetland 18 ITV Vera 19 Netflix The Night Agent 20 ITV Britain's Got Talent 21 ITV Maryland 22 BBC The Gold 23 ITV Grace 24 ITV The Hunt for Raoul Moat 25 ITV Endeavour 26 ITV The Long Shadow 27 Netflix Beckham 28 ITV The Bay 29 CH4 Gogglebox 30 BBC The Reckoning Series Ave aud (m) Episodes 3 12.8 14 9.1 21 8.5 12 8.5 23 8.4 1 8.4 1 8.3 2 8.2 5 8.2 1 8.0 12 8.0 26 7.2 17 7.1 2 7.0 2 7.0 Series Ave aud (m) Episodes 1 7.0 8 6.8 12 6.8 1 6.8 16 6.6 1 6.6 1 6.6 3 6.5 1 6.5 9 6.5 1 6.4 1 6.4 4 6.4 21 6.4 1 6.3 6 10 25 8 22 5 6 8 6 8 8 10 12 8 6 4 6 5 10 14 3 6 3 3 3 7 4 6 16 4 Source: Barb, 2023, Individuals. TV set viewing, Average audience per episode (excludes one-offs, kids, films and sports)
SVODs play a significant role in the top shows for 16-34s Top 30 series on UK Television 2023 (16-34, TV set viewing only) Channel Title Amazon Clarkson's Farm Netflix Sex Education Netflix Beckham ITV I'm a Celebrity... Get Me Out of Here! BBC Doctor Who BBC The Apprentice Netflix The Night Agent CH4 The Great British Bake Off Netflix At Home With The Furys BBC Happy Valley Netflix You Netflix Black Mirror Sky Atlantic The Last Of Us Netflix Queen Charlotte: A Bridgerton Story Amazon The Grand Tour Top 30 series on UK Television 2023 (16-34, TV set viewing only) Channel Title Disney+ The Mandalorian Netflix The Witcher Netflix Brooklyn Nine-Nine Netflix Wednesday Netflix Rick and Morty Amazon The Grand Tour Netflix Ginny & Georgia Netflix Murdaugh Murders: A Southern Scandal Netflix Top Boy Netflix Brooklyn Nine-Nine BBC Happy Valley CH4 Married at First Sight UK Netflix Brooklyn Nine-Nine Netflix Squid Game: The Challenge Netflix Bodies Rank 1 2 3 4 5 6 7 8 9 10 11 12 13 14 15 Series Ave aud (m) Episodes 2 2.7 4 2.2 1 2.0 23 1.8 2023 1.7 17 1.7 1 1.7 14 1.6 1 1.6 3 1.5 4 1.5 6 1.4 1 1.3 1 1.3 5 1.2 Rank 16 17 18 19 20 21 22 23 24 25 26 27 28 29 30 Series Ave aud (m) Episodes 3 1.2 3 1.2 8 1.1 1 1.1 6 1.1 4 1.0 2 1.0 1 1.0 3 1.0 3 1.0 1 1.0 8 1.0 4 0.9 1 0.9 1 0.9 8 8 4 22 3 12 10 10 9 6 10 5 9 6 2 8 8 10 8 10 4 10 3 6 23 6 3 22 10 8 Source: Barb, 2023, 16-34. TV set viewing, Average audience per episode (excludes one-offs, kids, films and sports)
Video advertising time has stabilised 0:20 MINS PER PERSON PER DAY (Individuals) 0:15 TikTok* YouTube* Other Online Video Cinema Broadcaster TV 0:10 0:05 0:00 2015 2016 2017 2018 2019 2020 2021 2022 2023 Source: Barb / Broadcaster stream data / IPA Touchpoints 2023 / UK Cinema Association / ViewersLogic to model OOH viewing time (*YouTube ad time modelled at 4.1% of content time and excludes those estimated to be on the YouTube Premium tier, TikTok ad time modelled at 3.4% of content time using agency and broadcaster data, Other online modelled at 4% of content time)
Video advertising time has stabilised 0:20 MINS PER PERSON PER DAY (16-34) 0:15 TikTok* YouTube* Other Online Video Cinema Broadcaster TV 0:10 0:05 0:00 2015 2016 2017 2018 2019 2020 2021 2022 2023 Source: Barb / Broadcaster stream data / IPA Touchpoints 2023 / UK Cinema Association / ViewersLogic to model OOH viewing time (*YouTube ad time modelled at 4.1% of content time and excludes those estimated to be on the YouTube Premium tier, TikTok ad time modelled at 3.4% of content time using agency and broadcaster data, Other online modelled at 4% of content time)
ALL INDIVIDUALS TV accounts for 83.5% of AV advertising time Average video advertising time per day 3.1% All Individuals: 17 mins 16-34s: 9.8 mins 11.4% 16-34s 0.5% 1.5% 11.7% TikTok* YouTube* 27.5% 53.8% Other online video 83.5% Cinema 5.4% 1.6% Broadcaster TV Source: Barb / Broadcaster stream data / IPA Touchpoints 2023 / UK Cinema Association / ViewersLogic to model OOH viewing time (*YouTube ad time modelled at 4.1% of content time and excludes those estimated to be on the YouTube Premium tier, TikTok ad time modelled at 3.4% of content time using agency and broadcaster data, Other online modelled at 4% of content time)
Weight of viewing is a critical analysis for reach planning All viewers of any video split into 10ths based on weight of viewing 11:00 10:00 9:00 AVERAGE TIME VIEWED 8:00 7:00 6:00 5:00 4:00 3:00 2:00 1:00 1.0m Non- viewers Lightest 10% Heaviest 10% Source: Barb, Sep 23, Total-identified viewing, All devices
All platforms obey Paretos law to varying degrees 66% of viewing 9:00 8:00 7:00 AVERAGE TIME VIEWED 6:00 71% of viewing 5:00 4:00 59% of viewing 67% of viewing 3:00 2:00 95% of viewing 1:00 Linear TV BVOD SVOD AVOD Video Sharing Each Decile = 5.2 million viewers (5.8m non-viewers) Each Decile = 4.2 million viewers (14.7m non-viewers) Each Decile = 4.5 million viewers (12.2m non-viewers) Each Decile = 0.1 million viewers (56.7m non-viewers) Each Decile = 4.7 million viewers (10.8m non-viewers) Source: Barb, Sep 23, All devices
What matters is the reach opportunity in ad-supported content TV set viewing to ad supported content 08:00 07:00 AVERAGE TIME VIEWED 06:00 YouTube 05:00 Other AVOD SVOD ad tiers (est) 04:00 Commercial BVOD Commercial Linear 03:00 02:00 01:00 00:00 5.0m Non- viewers Lightest 10% Heaviest 10% Source: Barb, Sep 23, decile ranked in terms of weight of viewing to linear TV, TV set viewing
BVOD & SVOD ad tiers are key to reaching lighter linear viewers AVE HRS OF TV SET VIEWING TIME PER GROUP PER DAY 00:04 00:33 00:53 00:44 00:47 01:04 01:20 01:46 02:32 03:45 07:21 100% 90% % DISTRIBUTION OF VIEWING BY PLATFORM 80% 70% 60% YouTube Other AVOD SVOD ad tiers (est) Commercial BVOD Commercial Linear 50% 40% 30% 20% 10% 0% Non - Lightest 10% Column1 Column2 Commercial linear viewers split into ten groups based on weight of viewing (Circa. 4.5m viewers per group) Column3 Column4 Column5 Column6 Column7 Column8 Heaviest 10% commercial linear (5m viewers) Source: Barb Sept 2023, Adults, TV set viewing, deciles ranked on weight of viewing to linear TV
Great planners map media on more than just reach Source: Richard Kirk EssenceMediacom
Mapping media on Influence Higher weekly reach 100% TV 90% 80% 70% Social media Radio 60% More trusted 50% 10% 15% 20% 25% 30% 35% 40% 45% Print 40% 30% YouTube 20% Bubble size = average media multiplier 10% 0% Source: IPA Touchpoints / Media Mix Navigator / YouGov 2024
Mapping media on Memorability 10 Ave ad view time (secs) 9 TV 8 7 6 5 0% 10% 20% 30% 40% 50% 60% More emotive 4 YouTube 3 Print 2 Social media OOH Bubble size = long-term multiplier 1 0 Source: Dentsu / Lumen / TVision / Media Mix Navigator / Thinkbox Adnormal Behaviour 2022
Mapping media on Sales power Lower cost per second of visual attention - 1.00 TV 2.00 YouTube 3.00 4.00 0% 10% 20% 30% 40% 50% 60% 70% 80% 90% 100% OOH 5.00 Social media 6.00 Higher weekly reach 7.00 8.00 Print 9.00 Bubble size = Total ROI Index Source: Dentsu / Lumen / TVision / Media Mix Navigator / Thinkbox Adnormal Behaviour 2022 10.00
Online born businesses account for 45% of TVs decline in 2023 1,200 2022 2023 LINEAR TV AD SPEND ( m) 1,000 800 600 400 200 - Online Born Food Cosmetics Ent & Leisure Govt / Charities HH FMCG Finance Telecoms Travel Autos Health HH Equp / DIY Retail Other Source: Nielsen Ad Intel
Linear pricing declined in 2023 6.31 5.75 5.56 5.45 5.35 5.17 5.12 5.10 5.07 4.70 4.67 4.66 4.60 4.17 Adults 2010 2011 2012 2013 2014 2015 2016 2017 2018 2019 2020 2021 2022 2023 14.93 13.91 13.57 13.56 13.46 12.77 12.73 12.58 12.48 12.19 12.14 11.88 11.71 10.12 Adult ABC1 2010 2011 2012 2013 2014 2015 2016 2017 2018 2019 2020 2021 2022 2023 69.14 67.99 54.51 37.71 34.13 32.31 28.18 26.98 26.22 22.62 20.32 20.12 20.04 19.99 16-34s 2010 2011 2012 2013 2014 2015 2016 2017 2018 2019 2020 2021 2022 2023 Source: Barb / AA/WARC
In real terms 2023 linear price for broad audiences is at an all-time low 7.01 6.81 6.73 6.71 6.63 6.55 6.41 6.34 6.27 6.16 6.12 6.10 5.56 4.92 Adults 2010 2011 2012 2013 2014 2015 2016 2017 2018 2019 2020 2021 2022 2023 17.33 17.45 17.14 16.75 16.25 15.93 15.69 15.63 15.56 15.49 15.44 15.23 13.91 11.95 Adult ABC1 2010 2011 2012 2013 2014 2015 2016 2017 2018 2019 2020 2021 2022 2023 73.79 67.99 62.82 44.99 40.30 39.20 34.99 34.36 33.71 29.20 28.60 27.64 26.78 26.61 16-34s 2010 2011 2012 2013 2014 2015 2016 2017 2018 2019 2020 2021 2022 2023 Source: Barb / AA/WARC / ONS Constant prices based on the value of the pound in 2023 historic prices factored for consumer price inflation
The threat to content media Publisher vs. non-publisher media investment as a % of UK GDP 1.2% Publisher media as a % of GDP Non-publisher media as a % of GDP 1.0% 0.8% 0.6% 0.4% 0.2% 0.0% 2000 2001 2002 2003 2004 2005 2006 2007 2008 2009 2010 2011 2012 2013 2014 2015 2016 2017 2018 2019 2020 2021 2022 2023(f) 2024(f) Source: AA / WARC / ONS
Spend at the pointy end of the funnel is spiralling upwards 16,000 Spend on Search / Retail Media 14,000 12,000 10,000 SPEND ( M) 8,000 6,000 4,000 2,000 - 2000 2001 2002 2003 2004 2005 2006 2007 2008 2009 2010 2011 2012 2013 2014 2015 2016 2017 2018 2019 2020 2021 2022 2023 Source: AA / WARC
ecommerce cost of sale advertising has rapidly increased Investment in search / retail media as a % of total ecommerce (UK) 14% 12% 10% 10% 10% 9% 8% 8% 8% 2015 2016 2017 2018 2019 2020 2021 2022 2023 (f) Source: AA / WARC, Centre for Retail Research
Should I spend the next pound on search or TV? Search TV Pros Pros Strong short-term ROI Very strong long-term ROI Capitalise on a creative advantage Potential to drive pricing power Increases the performance of search! Strong short-term ROI Attribute the spend back to sales Highly flexible Cons Cons Minimal long-term effect No creative advantage it s a spend arms race Hard to measure Linear price can be hard to predict Good creative requires craft & investment
Experienced marketers are betting on TV Change in linear TV spend 2023 Vs 2022 35 30 CHANGE IN SPEND YOY ( M) 25 20 15 10 5 - Procter & Gamble Ltd Unilever Uk Ltd Nestle Mondelez Uk Ltd Nissan Motor Gb Ltd Colgate Palmolive Ltd Premier Foods Ltd Reckitt Mars Wrigley P&o Cruises Plc Source: Nielsen Ad Intel