Understanding the Location of Gamma-Ray Emission Zones in Blazars

This research explores the determination of the GeV emitting zone in fast, bright blazars through studies conducted during the AAS Meeting in January 2014. The focus is on locating the gamma-ray emission zone within blazars and investigating the critical differences between various energy scales like the molecular torus and broad-line region. Flare decay times and their significance in pinpointing the GeV location are also discussed, along with applications to Fermi data analysis and fitting multiple models to understand the behavior of blazar emissions.

Download Presentation

Please find below an Image/Link to download the presentation.
The content on the website is provided AS IS for your information and personal use only. It may not be sold, licensed, or shared on other websites without obtaining consent from the author. Download presentation by click this link. If you encounter any issues during the download, it is possible that the publisher has removed the file from their server.
E N D
Presentation Transcript
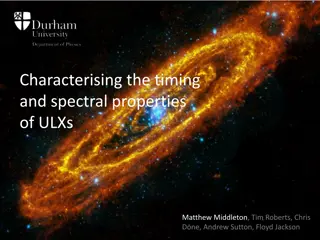
Determining the location of the GeV emitting zone in fast, bright blazars Amanda Dotson, UMBC Markos Georganopoulos (advisor), UMBC/GSFC Eileen Meyer, STScI Kevin McCann, UMBC AAS Meeting, Washington DC January 2014
The Issue At Hand Where is the gamma-ray emission zone (GEZ) in blazars? Molecular Torus (pc scale) ? ? Broad Line Region (sub-pc scale) Jet
Locating the GEZ with Flare Decay Times Unknown: GEZ Location ??? Observable: Fast gamma ray flares
Locating the GEZ with Flare Decay Times Critical difference between GEZ in BLR vs MT energy of the seed photons. GEZ Location 0,MT= 10-7 (~.1 eV) 0,BLR = 10-5 (~10 eV) Seed photon energy Electron cooling time energy dependence Thomson Regime ( 0 1) Klein-Nishina Regime ( 0 1) Observable: Flare decay time energy dependence Published in ApJL Dotson, et al. 2012
Locating the GEZ with Flare Decay Times MT BLR Cooling time nearly flat (energy independent) Cooling time energy dependent Dotson, et al. 2012 Falling time Electron cooling Seed Photons Photon origin
Application to Fermi Data Fit exponential rise/decay to each peak: Split data into high energy (HE) and low energy (LE) bands of TS PKS 1510 Unused Flare PKS 1510 Good Flare
Application to Fermi Data Fit multiple models Choose best fit using Bayesian information criterion (BIC L: Likelihood k: # model parameters n: # data points PKS 1510-089 1 peak model BIC = 0.863 BIC = 0.545 2 peak model BIC = 5.91 BIC = 5.61
An Interesting Flaring State of PKS 1510-089 Optical EVPA rotated by ~720 over the course of 5- day flaring period (6 flares total) % Optical polarization and R-band spike during -ray flaring period Later detection of new superluminal knot ejected from radio core Interpretation (from Marscher 2010): flaring state caused by knot travelling down spiral magnetic field and passing through a shock at pc-scale Plots from Marscher 2010
An Interesting Flaring State of PKS 1510-089 Optical EVPA rotated by ~720 over the course of 5- day flaring period (6 flares total) % Optical polarization and R-band spike during -ray flaring period Later detection of new superluminal knot ejected from radio core Image from Marscher 2010 Interpretation (from Marscher 2010): flaring state caused by knot travelling down spiral magnetic field and passing through a shock at pc scale Plots from Marscher 2010
Application to PKS 1510 Interesting Flares: Flare 5 LE (E<500 MeV) HE (E>500 MeV) Flux (ph s-1 cm-2)
Application to PKS 1510 Interesting Flares: Flare 7 LE (E<500 MeV) HE (E>500 MeV) Flux (ph s-1 cm-2)
Application to PKS 1510 Interesting Flares: Flare 7 LE (E<500 MeV) HE (E>500 MeV) Flux (ph s-1 cm-2)
An unusual case: Flare 8 LE (E<500 MeV) HE (E>500 MeV) Flux (ph s-1 cm-2) Very fast falling times (<3h) Fit unsuccessful LE flare seems to fall faster than HE flare
Summary & Conclusions Summary Theory predicts flare decay time energy dependence GeV photon origin (Dotson et al. 2012) Distinct falling times of flares 5, 7 (and 8?) indicate MT location of GeV emission zone In agreement with Conclusions This method has been successful in locating the GeV photon origin in 5 of the brightest flares of Fermi blazars within a few pc of the central black hole.
Dominant Source of Seed Photons Inside BLR Outside BLR Accretion Disk Photons BLR Photons MT Photons U AD ~ 10-3 ergs cm-3 U AD~10-3 ergs cm-3 U BLR ~ 1.0 ergs cm-3 U BLR ~ 10-6 ergs cm-3 U MT ~ 10-2 ergs cm-3 U MT~10-2 ergs cm-3 Assumptions: Ldisk = 1045 ergs s-1 , Lext=0.1Ldisk,Lsynch=1046 ergs s-1 RBLR = 1017 cm, RMT = 1018 cm, Rblob=1016 cm bulk=10
Cooling Differences BLR U =2.6 ergs cm-3 Dominated by emission lines 0 = 10-5 (~10 eV) R = 1017 cm MT U =2.6 10-2 ergs cm-3 BB emission, peaking at T~1000 K 0 = 10-7 (~.1 eV) R = 1018-19 cm The critical difference between the BLR and the MT is the energy of the seed photons.
Thomson vs KN Regime Thomson cross section (purely classical): Klein-Nishina cross section (derived through QED): 0 1 0 1 Scattering in the KN regime is much less efficient than scattering in the Thomson regime
Will light-travel effects erase cooling differences? Short answer: No.
Application to Fermi Data Upper limit on region of photon emission (RGeV)
Fitting Each component fit with exponential rise and decay: Fit different models (change # peaks, flat/sloped background,etc) Choose best fit model using BIC and AIC L: Likelihood k: # model parameters n: # data points
Future Work How does SSC model compare with these results? What is the energy dependence of Tf in the case of SSC? Is there a similar way of constraining RGeV for SSC seed photons?