SAIF Program at Rivier University: Assessment of Intellectual Functioning
Rivier University's Education Division offers the Specialist in Assessment of Intellectual Functioning (SAIF) Program led by John O. Willis, Ed.D. The program involves courses ED.656, .657, .658, and .659 focusing on statistics, test scores, measurement, and psychometrics. Resources from experts like W. Joel Schneider and Kevin McGrew provide detailed insights in the field. The program emphasizes the importance of accurate and diverse measurement methods in areas such as distances, temperatures, and more.

Download Presentation

Please find below an Image/Link to download the presentation.
The content on the website is provided AS IS for your information and personal use only. It may not be sold, licensed, or shared on other websites without obtaining consent from the author. Download presentation by click this link. If you encounter any issues during the download, it is possible that the publisher has removed the file from their server.
E N D
Presentation Transcript
Rivier University Education Division Specialist in Assessment of Intellectual Functioning (SAIF) Program ED 656, 657, 658, & 659 John O. Willis, Ed.D., SAIF 11.22.15 Rivier Univ. SAIF Statistics John O. Willis 1
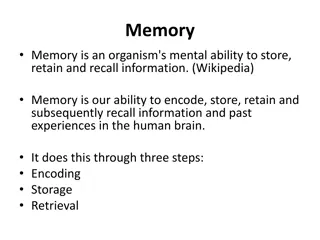
Statistics: Test Scores 11.22.15 Rivier Univ. SAIF Statistics John O. Willis 2
One measurement is worth a thousand expert opinions. . Donald Sutherland A little inaccuracy sometimes saves a ton of explanation. . H. H. Munro (Saki) 11.22.15 Rivier Univ. SAIF Statistics John O. Willis 3
For more accurate, more detailed, and more entertaining information on these topics, please see W. Joel Schneider's Psychometrics from the Ground Up at https://assessingpsyche. wordpress.com/psychometrics- from-the-ground-up/ 11.22.15 Rivier Univ. SAIF Statistics John O. Willis 4
and Kevin McGrew's Applied Psychometrics at http://themindhub.com/ research-reports 11.22.15 Rivier Univ. SAIF Statistics John O. Willis 5
We can measure the same thing with many different units. 11.22.15 Rivier Univ. SAIF Statistics John O. Willis 6
We measure the same distances with many different units. 11.22.15 Rivier Univ. SAIF Statistics John O. Willis 7
Disability Rights Center Low Avenue Phenix Avenue Main Street NH State House 0.1 miles 528 feet 176 yards 6,336 inches 161 meters 8 chains 32 rods 11.22.15 Rivier Univ. 8
We measure the same temperatures with many different units. 11.22.15 Rivier Univ. SAIF Statistics John O. Willis 9
C F K 100 212 373.15 37 98.6 310.15 0 32 273.15 -17.8 0 255.35 SAIF Statistics John O. Willis 10
Test authors and publishers feel compelled to do the same thing with test scores. 11.22.15 Rivier Univ. SAIF Statistics John O. Willis 11
Z scores - 4 - 3 - 2 - 1 0 1 2 3 4 Standard 40 55 70 85 100 115 130 145 160 Scaled 1 4 7 10 13 16 19 V- Scale 3 6 9 12 15 18 21 24 T 10 20 30 40 50 60 70 80 90 NCE 1 1 8 29 50 71 92 99 99 Percentile 0.1 0.1 2 16 50 84 98 99.9 99.9
SCORES USED WITH THE TESTS When a new test is developed, it is normed on a sample of hundreds or thousands of people. The sample should be like that for a good opinion poll: female and male, urban and rural, different parts of the country, different income levels, etc. 11.22.15 Rivier Univ. SAIF Statistics John O. Willis 13
The scores from that norming sample are used as a yardstick for measuring the performance of people who then take the test. This human yardstick allows for the difficulty levels of different tests. The student is being compared to other students on both difficult and easy tasks. 11.22.15 Rivier Univ. SAIF Statistics John O. Willis 14
You can see from the illustration below that there are more scores in the middle than at the very high and low ends. Many different scoring systems are used, just as you can measure the same distance as 1 yard, 3 feet, 36 inches, 91.4 centimeters, 0.91 meter, or 1/1760 mile. 11.22.15 Rivier Univ. SAIF Statistics John O. Willis 15
&& &&&&&& &&&&&& && &&&&&& &&&&&& &&&&&& &&&&&& &&&&&& &&&&&& &&&&&& &&&&&& &&&&&& &&&&&& &&&&&& &&&&&& &&&&&& &&&&&& &&&&&& &&&&&& &&&&&& && && There are 200 &s. Each && = 1%. & & & & &&&&&& &&&&&& &&&&&& &&&&&& & &&&&&& &&&&&& &&&&&& & &&&&&& &&&&&& &&&&&& &&&&&& & & & & Percent in each Standard Scores Scaled Scores T Scores Percentile Ranks Woodcock- Johnson Classif. 2.2% 69 6.7% 70 79 16.1% 80 89 50% 90 110 16.1% 111 120 6.7% 121 130 2.2% 131 1 2 3 4 5 6 7 8 9 10 11 12 13 14 15 16 17 18 19 29 30 36 37 42 43 56 02 03 08 09 24 25 75 Very Low Average Below Average 82 - 88 89 - 96 57 63 77 91 High Average Above Average 112 - 118 64 70 92 98 71 98 Very Superior Low Low Average Superior Low Average High Average 104 - 111 Very Low - 73 Low 74 - 81 Average 97 - 103 Very High 127 - High 119 - 126 Stanines Adapted from Willis, J. O. & Dumont, R. P., Guide to Identification of Learning Disabilities (3rd ed.)(Peterborough, NH: Authors, 2002, pp. 39-40). Also available at http://www.myschoolpsychology.com/testing-information/sample-explanations-of-classification-labels/ 11.22.15 Rivier Univ. SAIF Statistics John O. Willis 16
PERCENTILE RANKS (PR) simply state the percent of persons in the norming sample who scored the same as or lower than the student. A percentile rank of 63 would be high average as high as or higher than 63% and lower than the other 37% of the norming sample. It would be in Stanine 6. The middle 50% of examinees' scores fall between percentile ranks of 25 and 75. 11.22.15 Rivier Univ. SAIF Statistics John O. Willis 18
A percentile rank of 63 would mean that you scored as high as or higher than 63 percent of the people in the test s norming sample and lower than the other 37 percent . Never use the abbreviations %ile or %. Those abbreviations guarantee your reader will think you mean percent correct, which is an entirely different matter. 11.22.15 Rivier Univ. SAIF Statistics John O. Willis 19
Percentile ranks (PR) are not equal units. They are all scrunched up in the middle and spread out at the two ends. Therefore, percentile ranks cannot be added, subtracted, multiplied, divided, or therefore averaged (except for finding the median if you are into that sort of thing). 11.22.15 Rivier Univ. SAIF Statistics John O. Willis 20
NORMAL CURVE EQUIVALENTS (NCE) were like so many clear, simple, understandable things invented by the government. NCEs are equal-interval standard scores cleverly designed to look like percen- tile ranks. With a mean of 50 and standard deviation of 21.06, they line up with percentile ranks at 1, 50, and 99, but nowhere else, because percen- tile ranks are not equal intervals. 11.22.15 Rivier Univ. SAIF Statistics John O. Willis 21
Percentile Ranks and Normal Curve Equivalents PR 1 10 20 30 40 50 60 70 80 90 99 NCE 1 23 33 39 45 50 55 61 67 77 99 PR 1 3 8 17 32 50 68 83 92 97 99 NCE 1 10 20 30 40 50 60 70 80 90 99 11.22.15 Rivier Univ. SAIF Statistics John O. Willis 22
100 90 80 PR 70 NCE rubber band 60 50 stick 40 30 20 10 0 1 10 20 30 40 50 60 70 80 90 99 11.22.15 Rivier Univ. SAIF Statistics John O. Willis 23
A Normal Curve Equivalent of 57 would be in the 63rd percentile rank (Stanine 6). The middle 50% of examinees' Normal Curve Equivalent scores fall between 36 and 64. 11.22.15 Rivier Univ. SAIF Statistics John O. Willis 24
Because they are equal units, Normal Curve Equivalents can be added and subtracted, and most statisticians would probably let you multiply, divide, and average them. 11.22.15 Rivier Univ. SAIF Statistics John O. Willis 25
Z SCORES are the fundamental standard score. One z score equals one stan- dard deviation. Although only a few tests (favored mostly by occupational therapists) report them, z scores are the basis for all other standard scores. 11.22.15 Rivier Univ. SAIF Statistics John O. Willis 26
Z SCORES have an average (mean) of 0.00 and a standard deviation of 1.00. A z score of +0.33 would be in the 63rd percentile rank, and it would be in Stanine 6. The middle 50% of examinees' z scores fall between -0.67 and +0.67. 11.22.15 Rivier Univ. SAIF Statistics John O. Willis 27
Wechsler-type STANDARD SCORES ("quotients" on some tests) have an average (mean) of 100 and a standard deviation of 15. A standard score of 105 would be in the 63rd percentile rank and in Stanine 6. The middle 50% of examinees' standard scores fall between 90 and 110. 11.22.15 Rivier Univ. SAIF Statistics John O. Willis 28
[Technically, any score defined by its mean and standard deviation is a standard score, but we usually (except, until recently, with tests published by Pro-Ed) use standard score for standard scores with mean = 100 and s.d. = 15.] 11.22.15 Rivier Univ. SAIF Statistics John O. Willis 29
Wechsler-type SCALED SCORES ("standard scores" [which they are] on some Pro-Ed tests) are standard scores with an average (mean) of 10 and a standard deviation of 3. A scaled score of 11 would be in the 63rd percentile rank and in Stanine 6. The middle 50% of students' standard scores fall between 8 and 12. 11.22.15 Rivier Univ. SAIF Statistics John O. Willis 30
V-SCALE SCORES have a mean of 15 and standard deviation of 3 (like Scaled Scores). A v-scale score of 16 would be in the 63rd percentile rank and in Stanine 6. The middle 50% of examinees' V-Scale Scores fall between 13 and 17. V-Scale Scores simply extend the Scaled- Score range downward for the Vineland Adaptive Behavior Scales. 11.22.15 Rivier Univ. SAIF Statistics John O. Willis 31
T SCORES have an average (mean) of 50 and a standard deviation of 10. A T score of 53 would be in the 62nd percentile rank, Stanine 6. The middle 50% of examinees' T scores fall between approximately 43 and 57. [Remember: T scores, Scaled Scores, NCEs, and z scores are actually all standard scores.] 11.22.15 Rivier Univ. SAIF Statistics John O. Willis 32
CEEB SCORES for the SATs, GREs, and other Educational Testing Service tests used to have an average (mean) of 500 and a standard deviation of 100. A CEEB score of 533 would have been in the 62nd percentile rank, Stanine 6. The middle 50% of examinees' CEEB scores used to fall between approximately 433 and 567. 11.22.15 Rivier Univ. SAIF Statistics John O. Willis 33
BRUININKS-OSERETSKY SUBTEST SCALE SCORES have an average (mean) of 15 and a standard deviation of 5. A Bruininks-Oseretsky (BOT-2) Scale Score of 17 would be in the 66th percentile rank, Stanine 6. The middle 50% of examinees' scores fall between approximately 12 and 18. 11.22.15 Rivier Univ. SAIF Statistics John O. Willis 34
QUARTILES ordinarily divide scores into the lowest, antepenultimate, penultimate, and ultimate quarters (25%) of scores. However, they are sometimes modified in odd ways. DECILES divide scores into ten groups, each containing 10% of the scores. 11.22.15 Rivier Univ. SAIF Statistics John O. Willis 35
STANINES (standard nines) are a nine-point scoring system. Stanines 4, 5, and 6 are approximately the middle half (54%)* of scores, or average range. Stanines 1, 2, and 3 are approximately the lowest one fourth (23%). Stanines 7, 8, and 9 are approximately the highest one fourth (23%). _________________________ * But who s counting? 36
Why do authors and publishers create and select all these different scores? 11.22.15 Rivier Univ. SAIF Statistics John O. Willis 37
Immortality. We still talk about Wechsler-type standard scores with a mean of 100 and standard deviation (s.d.) of 15. [Of course, Dr. Wechsler s name has also gained some prominence from all the tests he published before and after his death in 1981.] 11.22.15 Rivier Univ. SAIF Statistics John O. Willis 38
Retaliation? I have always fantasized that the 1960 conversion of Stanford-Binet IQ scores to a mean of 100 and s.d. of 16resulted from Wechsler s grabbing market share from the 1937 Stanford-Binet with his 1939 Wechsler-Bellevue and 1949 WISC and other tests. 11.22.15 Rivier Univ. SAIF Statistics John O. Willis 39
My personal hypothesis was that when Wechsler s deviation IQ (M = 100, s.d. = 15) proved to be such a popular improvement over the Binet ratio IQ (Mental Age/ Chronological Age x 100) (MA/CA x 100) there was no way the next Binet edition was going to use that score. [This idea is probably nonsense, but I like it.] 11.22.15 Rivier Univ. SAIF Statistics John O. Willis 40
[Wechsler went with a deviation IQ based on the mean and s.d. because the old ratio IQ (MA/CA x 100) did not mean the same thing at different ages. For instance, an IQ of 110 might be at the 90th percentile at age 12, the 80th at age 10, and the 95th at age 14. The deviation IQ means the same thing at all ages.] 11.22.15 Rivier Univ. SAIF Statistics John O. Willis 41
[The raw data from the Binet ratio IQ scores did show a mean of about 100 (mental age = chronological age) and a standard deviation, varying considerably from age to age, of something like 16 points, so both the Binet and the Wechsler choices were reasonable. However, picking just one would have made life a lot easier for evaluators from 1960 to 2003.] 11.22.15 Rivier Univ. SAIF Statistics John O. Willis 42
In any case, the subtle difference between s.d. 15 and 16 (WISC 115 = Binet 116, WISC 85 = Binet 84, WISC 145 = Binet 148, etc.) plagued evaluators with the 1960/1972 and 1986 editions of the Binet. The 2003 edition finally switched to s.d. 15. 11.22.15 Rivier Univ. SAIF Statistics John O. Willis 43
Matching the precision of the score to the precision of the measurement. Total or compos- ite scores based on several subtests are usually sufficiently reliable and based on sufficient items to permit a fine-grained 15-point subdivision of each standard deviation (standard score). 11.22.15 Rivier Univ. SAIF Statistics John O. Willis 44
It can be argued that a subtest with less reliability and fewer items should not be sliced so thin. There might be fewer than 15 items! A scaled score dividing each standard deviation into only 3 points would seem more appropriate, but there are consequently big jumps between scores on such scales. 11.22.15 Rivier Univ. SAIF Statistics John O. Willis 45
The Vineland Adaptive Behavior Scale v-scale extends the scaled score measurement downward another 5 points to differentiate among persons with very low ratings because the Vineland is often used with persons who obtain extremely low ratings. The v-scale helpfully subdivides the lowest 0.1% of ratings. 11.22.15 Rivier Univ. SAIF Statistics John O. Willis 46
T scores, dividing each standard deviation into 10 slices, are finer grained than scaled scores (3 slices), but not quite as narrow as standard scores (15). The Differential Ability Scales, Reynolds Intellectual Assessment Scales, and many personality and neuropsychological tests and inventories use T scores. 11.22.15 Rivier Univ. SAIF Statistics John O. Willis 47
Dr. Bill Lothrop often quoted Prof. Charles P. "Phil" Fogg: Gathering data with a rake and examining them under a microscope. Test scores may give the illusion of greater precision than the test actually provides. 11.22.15 Rivier Univ. SAIF Statistics John O. Willis 48
However, Kevin McGrew (http://www.iapsych.com/iapap 101/iap101brief5.pdf) warns us that wide-band scores, such as scaled scores, can be dangerously imprecise. For example a scaled score of 4 might be equivalent to a standard score of 68, 69, or 70 (the range usually associated with intellectual disability) or 71 or 72 (above that range). 11.22.15 Rivier Univ. SAIF Statistics John O. Willis 49
That lack of precision can have severe consequences when comparing scores, tracking progress, and deciding whether a defendant is eligible for special education or for the death penalty (http://www.atkinsmrdeath penalty.com/). 11.22.15 Rivier Univ. SAIF Statistics John O. Willis 50


 simply")
 are not equal")


")