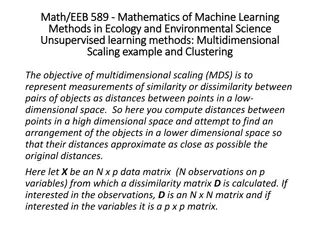
Searching for Nearest Neighbors and Aggregate Distances in Plane Algorithms

This overview discusses different algorithms related to nearest neighbor searching and aggregate distances in the plane. It covers concepts like aggregate-max, group nearest neighbor searching, applications in meeting location optimization, and previous heuristic algorithm work. Results include preprocessing and query time complexities for efficient data processing.

Download Presentation

Please find below an Image/Link to download the presentation.
The content on the website is provided AS IS for your information and personal use only. It may not be sold, licensed, or shared on other websites without obtaining consent from the author. Download presentation by click this link. If you encounter any issues during the download, it is possible that the publisher has removed the file from their server.
E N D
Presentation Transcript
Aggregate Aggregate- -Max Nearest Neighbor Max Nearest Neighbor Searching in the Plane Searching in the Plane Haitao Wang Utah State University CCCG 2013
Nearest neighbor searching Nearest neighbor searching Input: a set P of n red points Query: a query blue point q report the nearest red point to q
Aggregate/Group nearest neighbor Aggregate/Group nearest neighbor searching searching Input: a set of n red points Query: a set Q of m query blue points report the nearest red point to Q
What is the nearest neighbor to Q? What is the nearest neighbor to Q? For any red point p in P, the aggregate distance from p to Q: the farthest distance from p to the points of Q that s why it is called Aggregate-max The nearest neighbor of Q: the red point whose aggregate distance to Q is the minimum p
An application An application A group of people want to meet together given a set of candidate meeting locations find a location that minimizes the longest distance to all people
Previous work Previous work Heuristic algorithms given in the database area Minimum bounding method (Papadias et al, TODS 2005) R-trees (Li et al, TKDE 2011) (n+m) time in the worst case (1+ )-approximation result (Li et al, TKDE 2011) Aggregate-sum version 3-approximation (Li et al, SIGMOD 2011) (1+ )-approximation (Agarwal et al, PODS 2012)
Our results Our results Preprocessing: O(n log n) time and O(n log log n) space Query: O(mn1/2logO(1)n) time Or, Preprocessing: O(n2+ ) time and space for any > 0 Query: O(m log n) time n: the number of input points m: the number of query points m<<n
Our results Our results the L the L1 1distances distances The L1distances Preprocessing: O(n log n) time and O(n) space Query: O(m+logn) time Top-k queries: Report the k nearest neighbors to Q Preprocessing: O(n log n) time and O(n) space Query: O(m+klogn) time vertical distance e horizontal distance The L1distance of e = the horizontal distance + the vertical distance
A simple observation A simple observation For any red point p, how to determine the farthest point q of Q to p? An observation: q is the point whose farthest Voronoi region contains p q p
A query algorithm A query algorithm For each blue point q that defines a farthest Voronoi region FVR(q) find the nearest neighbor of q in FVR(q) Return the shortest distance q Difficulty: How to find the nearest neighbor of q in FVR(q)? FVR(q)
A solution: maintain A solution: maintain Voronoi Voronoi diagrams diagrams Obtain the Voronoi diagram of the red points in FVR(q) Determine the Voronoi region that contains q q FVR(q)
The new problem: answering The new problem: answering Voronoi diagram queries diagram queries Voronoi For a set of points in the plane, query: a triangle return (implicitly) the Voronoi diagram of the points in the triangle Our approach: Using the simplex range searching data structures (Matousek 92 , 93 , Chan 12 ) For each canonical subset of points, maintain its Voronoi diagram explicitly
The L The L1 1version version For any red point p easy to determine the farthest point of Q to p one of the four extreme points The farthest Voronoi diagram of Q is determined by the four extreme points p
The key problem: determine the The key problem: determine the nearest neighbor of q in FVR(q)? nearest neighbor of q in FVR(q)? The solution for L2: maintaining Voronoi diagrams A better solution for L1: using segment dragging queries FVR(q) q
A key observation on A key observation on the shape of FVR(q) FVR(q): only : only three three types the shape of types Type-A bounded by two vertical half-lines and a segment of slope -1 in between On the right of the vertical line through q b is on the horizontal line through q assume q is the extreme point along the southwest direction FVR(q) a b q
The shape of FVR(q): three types The shape of FVR(q): three types Type-B bounded by a vertical half-line, a horizontal half-line, and a segment of slope -1 in between in the first quadrant with respect to q FVR(q) a b q
The shape of FVR(q): three types The shape of FVR(q): three types Type-C symmetric to the Type-A a q FVR(q) b
The shape of FVR(q): three types The shape of FVR(q): three types FVR(q) FVR(q) a a a b q b b q q FVR(q) B A C
Determining nearest neighbor in type Determining nearest neighbor in type- - A regions A regions Partition FVR(q) into three subregions Find the nearest neighbor in each subregion a b q
The shape of FVR(q): three types The shape of FVR(q): three types a a a b q b b q q B A C
Segment dragging queries Segment dragging queries Preprocessing: O(nlog n) time and O(n) space Query: O(log n) time out-of-corner queries: Mitchell 92 parallel-track queries: Chazelle 88 out-of-corner query parallel-track query
The query algorithm The query algorithm a summary a summary Given a query set Q: Compute the farthest Voronoi diagram O(m) time For each extreme point q, determine the nearest point of P in FVR(q) O(log n) time by segment dragging queries Total query time: O(m + log n)
Extended to the top Extended to the top- -k queries k queries After the nearest point is found in a subregion, keep searching the next nearest point by segment dragging queries a tempting approach: keep using another out-of-corner query does not work!! the interior of the purple triangle should not contain any point a q
Extended to the top Extended to the top- -k queries k queries Our approach: partition into three smaller regions: an out-of-corner query for the green region parallel-track queries for the blue regions Total query time: O(m+klog n) a q
Thank You Thank You


: three types")
: three types")
: three types")

: three types")