Economic Realities of Scottish Bus Industry and Transport Bill 2018
The Scottish bus industry and the Transport Bill of 2018 are explored in relation to economic provisions and their alignment with the realities of bus operation in Scotland. Key aspects include Bus Service Improvement Partnerships, Local Service Franchises, and the historical context of the bus industry in Scotland. The discussion delves into the impact of regulatory measures, competition, and major players in the industry.

Download Presentation

Please find below an Image/Link to download the presentation.
The content on the website is provided AS IS for your information and personal use only. It may not be sold, licensed, or shared on other websites without obtaining consent from the author. Download presentation by click this link. If you encounter any issues during the download, it is possible that the publisher has removed the file from their server.
E N D
Presentation Transcript
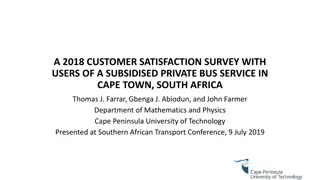
The Scottish bus industry, the Transport Bill (2018) and the economic realities, two different things? Jonathan Cowie Transport Research Institute Edinburgh Napier University SESTran Bus Stakeholder Event, Friday 8thFebruary, Victoria Quay, Edinburgh
Outline The (direct) economic provisions of the Transport Bill Examine some statistics Macro and micro Do the provisions of the Transport Bill match the economic realities of the Bus Industry?
The Transport Bill Will not outline this in detail, as can be very quickly summarised as: Two specific measures: Bus Service Improvement Partnerships Local Service Franchises Both powers are optional, and I see no difference between the two: Little mention of real partnership in the first Accept it would be in the detail, but the only reference to any input on the part of operators is where a local authority may not progress one where a sufficient number of persons who are operators object to it being made , mmm But the local authority could then move to a Local Service Franchise In other words, what both represent is the full spectrum of economic regulation, where in the first case one or more service standards are regulated, through to a fully (economic) regulated market (access, fares, frequencies, vehicle standards) In terms of franchises, these may be subsidised or the operator pays the local authority to run the service (i.e. plain daft, is this realistic and if so, why not lower bus fares??) No detail on the process, i.e. competitive tender or negotiation, but a subsidised network would have to be CT? (anyone heard of Altmark?) Also LEZs, but the impact of these others in the room are far better qualified to talk about, but can assume these will increase the cost of operation further
The Transport Bill Raises many many issues, which we don t have time to consider Hence this will examine the extent to which these particular provisions match the economic realities of bus operation in Scotland
The Bus Industry in Scotland Transport Act 1980, 1985 and Transport Act (Scotland) 1989. Created 14 bus companies, 10 from Scottish Bus Group, 4 out of public administration All bar one sold between 1988 and 1993 Industry developed through a process of merger and acquisition, hence competitive, but not in the sense of the 1985 Act Resulted in the annexing of territory, with the old adage that in business only three things matter Location, location, location What emerged in Scotland is an industry dominated by two of the main British players, Stagecoach and First, with a small presence from National Express. Two independents , McGills and Lothian Buses Of 14 companies privatised, 12 remain in existence today, but there has been some restructuring over the intervening years.
Selective Literature Review Previous research has generally found outcomes consistent with profiteering uncompetitive industry: White and Farrington (1998), rising real fares, patronage declines Cowie (2001), mergers/acquisitions driven by strategy, not returns to scale Preston and Almutairi (2013), welfare gains, but due to producer gains through cost reductions (in the long run) Van de Velde and Wallis (2013), increase in bus kilometres, but negative image due to passenger declines, fare increases, loss of integration But did find some successes in areas of pro-active public transport policies that restricted car use Cowie (2014) only limited evidence of consumer sovereignty (27%), but also found emerging evidence of structural decline, 28% of operators mature marketers .
Scottish Bus Industry Examine the Scottish bus industry from two perspectives One at a macro level using Government statistics One at a micro level using company specific data Only profit margins, but other analysis available on request Hence what has been happening in Scotland and how has this impacted upon the economics of Scottish bus operation.
Passenger Receipts, bus fare index and changes in PT subsidy Bus fares, increase by around 1% a year Passenger receipts, 5% decline Considerable increase in LA spend on bus transport, with rough estimate of a 30% increase in contract prices 250.00 200.00 150.00 100.00 50.00 0.00 Reciepts Bus Fares Subsidy Source: Compiled from Scottish Bus and Coach Statistics (e.g. Scottish Government 2010, Scottish Office 1998).
Scottish Bus Patronage, Commercial and Subsidies Bus Kilometres 180.00 Patronage, long slow decline, 20% Bus kilometres, hold up to 2007, then decline, 14% Subsidised bus km, large increase to 2008, but over the whole period, small increase But note effect is exaggerated , 15 20% of all bus km 160.00 140.00 120.00 100.00 80.00 60.00 40.00 1994 1995 1996 1997 1998 1999 2000 2001 2002 2003 2004 2005 2006 2007 2008 2009 2010 2011 2012 2013 2014 2015 Patronage Commercial Bus Km Subsidised Cost per Bus Km Source: Compiled from Scottish Bus and Coach Statistics (e.g. Scottish Government 2010, Scottish Office 1998). Significant cost increases since 2005 Inefficiency?, efficiency?, PSV accessibility regs 2000? Change in mix ?
Passenger Receipts, Total Public Finance and Concessionary Fare Re-imbursement Significant increase in the level of public finance support, 30% of total revenue to 45%, even as high as 48% at one point Increase in concessionary fares, no better or worse off , but some evidence this represents minor form of indirect support (Rye and Carreno, 2008) 450.0 400.0 350.0 300.0 250.0 200.0 150.0 100.0 50.0 0.0 Total Public Finance Passenger Revenue Concessionary Fares Source: Compiled from Scottish transport statistics (e.g. Scottish Government 2010, Scottish Office 1998, Transport Scotland 2017).
Scottish Area Wide Analysis Summary May be hugely simplistic, but to summarise: Falling demand, falling supply, increasing fares, increased dependence on public finance All of which suggests an industry in long term gradual structural decline Nothing new, but the view has been that privatisation and deregulation have increased the rate of this decline, bus companies have been uncompetitive (profit maximising monopolists) thus the solution is to reverse that process competition is the answer, i.e. the same fallacy of the Transport Act 1985 It thus assumes there is some slack in the industry that can be cut But to what extent does this represent the changing economic realities of bus operation? Much of the answer is already there, but can get hidden in the smoke screen Business operating closer to the margin, more market focused Profitability?
Profit Margins Clearly divides into two periods, good and not so good Even in the good period, profit margins were falling Big change at the oil price increase followed by the financial crisis Post period, Eng Mets and Non Mets average 10/11%, Scotland 9% and London 5 - 8% 5 - 8% therefore appears to represent normal profit (i.e. a fair return). 45.0% 40.0% 35.0% 30.0% 25.0% 20.0% 15.0% 10.0% 5.0% 0.0% 1994 1996 1998 2000 2002 2004 2006 2008 2010 2012 2014 2015 -5.0% -10.0% All London English Mets English Rest Scotland Source: Compiled from the TAS Bus Industry Monitor
Profit Margins But important differences between London and deregulated markets Contracts are full cost, hence no revenue risk to the operator No route planning, ticketing or marketing functions Size of contracts, cumulatively these are substantially larger All of these would suggest margins in the deregulated areas are close to normal profit margins This has wider implications with regard to prices, frequencies and services run 45.0% 40.0% 35.0% 30.0% 25.0% 20.0% 15.0% 10.0% 5.0% 0.0% 1994 1996 1998 2000 2002 2004 2006 2008 2010 2012 2014 2015 -5.0% -10.0% All London English Mets English Rest Scotland Source: Compiled from the TAS Bus Industry Monitor
Summation/Conclusions Are all ills with the bus sector connected to the Transport Act 1985? Analysis suggests that any slack in the sector has been eradicated over time Also suggests competitive tendering may have little if zero effect in Scotland (and elsewhere), due to Market position, business risk and difficulty of out bidding any current incumbents You can take bus markets away from operators, but not bus territories (well ) We already have efficient market outcomes, competition (or negotiation?) for the market therefore will make no difference, if anything will only add transaction costs Policy implications? Improve the attractiveness of the bus (partnership working?) Perhaps to be followed by some form of economic re-regulation That does not have to be in the form of competitive tender Ultimately however this depends on real political will Key issue is that policy needs to be far more holistic in it s outlook, not sector focused, and move on from the Transport Act 1985
")