Educational Adequacy Assessments in Fargo Public Schools

Detailed findings and methodology of educational adequacy assessments conducted in Fargo Public Schools on October 10th, 2023, including thorough inspections, categorization of elements, cost analysis, ideal target cost and square footage calculations, and maximum achievable scores. The assessments aimed to evaluate the adequacy and capacity of school buildings regarding various essential factors such as space, safety, security, and overall functionality.

Download Presentation

Please find below an Image/Link to download the presentation.
The content on the website is provided AS IS for your information and personal use only. It may not be sold, licensed, or shared on other websites without obtaining consent from the author. Download presentation by click this link. If you encounter any issues during the download, it is possible that the publisher has removed the file from their server.
E N D
Presentation Transcript
Fargo Public Schools Fargo Public Schools Educational Adequacy and Educational Adequacy and Capacity Capacity Findings October 10th, 2023 Findings
EDUCATIONAL ADEQUACY ASSESSMENTS EDUCATIONAL ADEQUACY ASSESSMENTS OVERVIEW OVERVIEW Process Process + Walked & assessed all buildings in July Measured for square footage Inventory of room number and space type Noted existence of required elements by category: Electrical outlets, motion sensor lights FFE storage casework, age-appropriate flexible seating Mechanical kiln exhaust system Physical Attributes flooring, access to natural light Plumbing science lab sinks, on-suite restroom Safety & Security fire horn system, secure vestibule Site bus lane, parent drop off queue, acreage
EDUCATIONAL ADEQUACY ASSESSMENTS EDUCATIONAL ADEQUACY ASSESSMENTS OVERVIEW OVERVIEW Methodology Methodology + Standards by school type were developed based on discussions with FPS staff, and HPM best practices Number and size of spaces Elements within each space type Site level elements + A cost is assigned to all elements and space + The cost of the elements and space not present within the building is compared to the ideal target cost + This allows us to develop a score and deficiency cost for each building
EDUCATIONAL ADEQUACY ASSESSMENTS EDUCATIONAL ADEQUACY ASSESSMENTS OVERVIEW OVERVIEW Why ideal target cost and square footage? Why ideal target cost and square footage? + Sq ft per student of based on grade level and capacity was used to calculate target square footage and replacement cost + 4 different elementary models (2, 3, 4, and 5 section capacity) + 1,000 student middle school model + 1,300 student high school + This helps determine a standard to compare each building to + Some buildings may have missing spaces compared to the capacity model (commons, art room, etc.)
EDUCATIONAL ADEQUACY ASSESSMENTS EDUCATIONAL ADEQUACY ASSESSMENTS MAXIMUM SCORE MAXIMUM SCORE Schools Can Have a Maximum Possible Score NOT equal to 100 Only way to exceed maximum possible score is to either replace, add to, or alter the existing facility.
EDUCATIONAL ADEQUACY ASSESSMENTS EDUCATIONAL ADEQUACY ASSESSMENTS SCORING SCORING
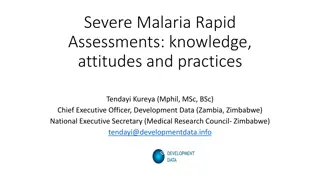
EDUCATIONAL ADEQUACY ASSESSMENTS EDUCATIONAL ADEQUACY ASSESSMENTS Current and Maximum Score by Campus 0.0% 10.0% 20.0% 30.0% 40.0% 50.0% 60.0% 70.0% 80.0% 90.0% 100.0% Bennett Elementary 89.2% 91.4% Centennial Elementary 81.5% 84.4% Overall Score & Overall Score & Max Score Max Score Elementary Elementary Schools Schools Clara Barton Elementary 73.8% 76.4% Eagles Elementary 84.6% 85.8% Ed Clapp Elementary 91.2% 92.6% Hawthorne Elementary 65.5% 67.3% Horace Mann Elementary 67.4% 71.5% Jefferson Elementary 78.6% 80.5% Kennedy Elementary 91.4% 93.5% Lewis and Clark Elementary 80.4% 82.8% Lincoln Elementary 82.3% 84.4% Longfellow Elementary 85.0% 87.2% Madison Elementary 79.1% 82.9% McKinley Elementary 71.2% 75.3% Roosevelt Elementary 67.1% 71.7% Washington Elementary 80.1% 83.1% Current Score Max Score
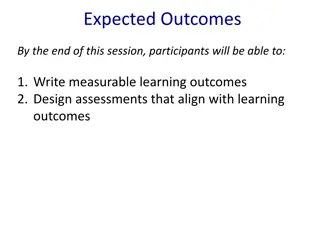
EDUCATIONAL ADEQUACY ASSESSMENTS EDUCATIONAL ADEQUACY ASSESSMENTS Current and Maximum Score by Campus 0.0% 10.0% 20.0% 30.0% 40.0% 50.0% 60.0% 70.0% 80.0% 90.0% 100.0% Overall Score & Overall Score & Max Score Max Score Middle and High Middle and High Schools Schools Ben Franklin Middle 74.7% 76.2% Carl Ben Eielson Middle 78.5% 79.4% Discovery Middle 89.9% 91.5% Davies High School 93.2% 94.1% North High School 87.1% 88.0% South High School 91.7% 92.9% Current Score Max Score
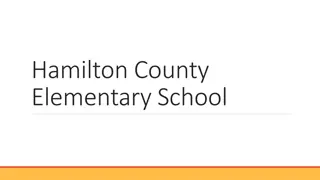
EDUCATIONAL ADEQUACY ASSESSMENTS EDUCATIONAL ADEQUACY ASSESSMENTS SUMMARY SUMMARY Priority by Campus (Missing Space is Priority 3) $- $2,000,000.00 $4,000,000.00 $6,000,000.00 $8,000,000.00 $10,000,000.00 $12,000,000.00 $14,000,000.00 $16,000,000.00 Bennett Elementary Centennial Elementary Priority by Priority by Campus Campus Clara Barton Elementary Eagles Elementary Ed Clapp Elementary Hawthorne Elementary Horace Mann Elementary Jefferson Elementary Kennedy Elementary Lewis and Clark Elementary Lincoln Elementary Longfellow Elementary Madison Elementary McKinley Elementary Roosevelt Elementary Washington Elementary Ben Franklin Middle Carl Ben Eielson Middle Discovery Middle Davies High School North High School South High School Priority 1 Priority 2 Priority 3
EDUCATIONAL ADEQUACY ASSESSMENTS EDUCATIONAL ADEQUACY ASSESSMENTS SUMMARY SUMMARY Deficiency Allocation by Program Area $- $2,000,000.00 $4,000,000.00 $6,000,000.00 $8,000,000.00 $10,000,000.00 $12,000,000.00 $14,000,000.00 $16,000,000.00 Bennett Elementary Deficiency Deficiency by Program by Program Area Area Centennial Elementary Clara Barton Elementary Eagles Elementary Ed Clapp Elementary Hawthorne Elementary Horace Mann Elementary Jefferson Elementary Kennedy Elementary Lewis and Clark Elementary Lincoln Elementary Longfellow Elementary Madison Elementary McKinley Elementary Roosevelt Elementary Washington Elementary Ben Franklin Middle Carl Ben Eielson Middle Discovery Middle Davies High School North High School South High School Administration Dining Physical Education Library Media Center Core Academics Visual Arts Performing Arts Special Education CTE Building Circulation Site
Capacity Analysis Capacity Analysis
CAPACITY ANALYSIS CAPACITY ANALYSIS METHODOLOGY METHODOLOGY K-5 Building Total Recommended Art/Music 3 Remaining Standard CR's 25 Self-Contained SPED Classrooms 29 1 Remaining Standard CR's 25 Number of Grades 6 # of Sections a building can support 4 Number of Grades 6 # of Sections Capacity Classrooms "Flex" CR's 4 24 1 Elementary Elementary + Operate on a homeroom model + Specialty spaces such as art, music, gym don t carry capacity + Section based capacity model (# of CR s for each grade) + Total classrooms minus recommended Art/Music and any Self-Contained SPED + Allows for equitable program offerings at ES, based on size of building + Remaining count divided by number of grades within the building to determine # of sections and capacity bearing classrooms + May result in additional flex classrooms Capacity Classrooms 24 Weighted Class Size 22.67 Building Capacity 544
CAPACITY ANALYSIS CAPACITY ANALYSIS ELEMENTARY SCHOOLS ELEMENTARY SCHOOLS Average Class Size 22.67 21.33 24 8 Grade Level K-5 Building K-2 Building 3-5 Building Self-Contained SPED Based on classroom target enrollment numbers from September 2022 LRFP
CAPACITY ANALYSIS CAPACITY ANALYSIS METHODOLOGY METHODOLOGY Middle & High School Middle & High School + Function differently than ES students move throughout the building + Capacity is assigned to all teaching spaces + Scheduling factor is applied to account for course offerings, planning periods, lunch periods + Middle 62.5% factor (5 out of 8 periods) + High 75% factor (6 out of 8 periods)
CAPACITY ANALYSIS CAPACITY ANALYSIS MIDDLE & HIGH SCHOOLS MIDDLE & HIGH SCHOOLS Program Area General CR, Electives Art, Music, Science CTE PE Self-Contained SPED Based on classroom target enrollment numbers from September 2022 LRFP Class Size 27 27 20 54 8
Questions? Questions?