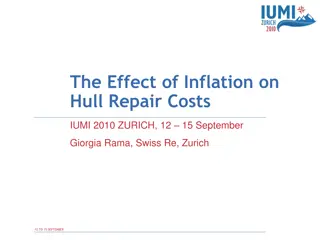
Analysis of Faculty Salaries Proposal and Inflation Rates Over the Years

This data compilation presents a detailed overview of Full Professor salaries in West Virginia compared to national averages, alongside historical inflation rates. It discusses trends from 2007 to 2012, including a forecast of the U.S. inflation rate. The provided images highlight key figures and data points, offering valuable insights for understanding salary structures and economic changes.

Download Presentation

Please find below an Image/Link to download the presentation.
The content on the website is provided AS IS for your information and personal use only. It may not be sold, licensed, or shared on other websites without obtaining consent from the author. Download presentation by click this link. If you encounter any issues during the download, it is possible that the publisher has removed the file from their server.
E N D
Presentation Transcript
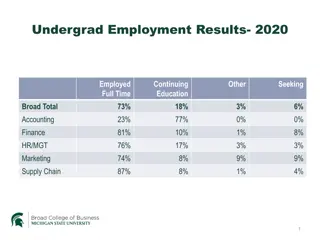
Full Professor 200,000 180,000 160,000 140,000 120,000 WV avg 100,000 National avg SREB 80,000 60,000 40,000 20,000 0 2007-08 2008-09 2009-10 2010-11 2011-12
WV salaries #REF! 1.2 1 0.8 0.6 #REF! 0.4 0.2 0 2007-08
Table of Inflation Rates by Year 2005 2006 2007 2008 2009 2010 2011 3.4 3.2 2.8 3.8 -0.4 1.6 3.2 %
Historical US Inflation Rate http://www.forecast-chart.com/forecast-inflation-rate.html Annual Inflation Rates Last Month Last Year . . . . . . . . . . . . . . . . . . . . 1.7% Last 5 Years Last 10 Years . . . . . . . . . . . . . . . . . 2.5% Last 20 Years -1.8% 2.2% 2.5% Thus typical is 2.5%
U.S. Inflation Rate Forecast Year Over Year Change in Consumer Price Index Percent http://www.forecasts.org/inflation.htm Month 0 1 2 3 4 5 6 Updated Tuesday, July 17, 2012 Date Jun 2012 Jul 2012 Aug 2012 1.6 Sep 2012 1.8 Oct 2012 Nov 2012 2.5 Dec 2012 3.1 Forecast % 1.68 1.5 2.2