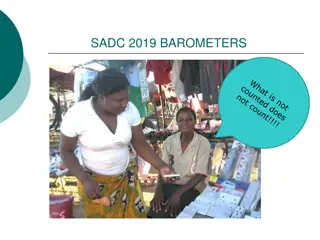
Buckinghamshire Business Barometer October 2022 Findings
The Buckinghamshire Business Barometer presents findings from the Quarter 2, 2022 survey, highlighting a substantial negative impact on trading conditions and business performance. The report delves into various aspects such as rising business costs, severity of cost increases, and the implications on prices. Despite some improvements, challenges persist, affecting businesses in Buckinghamshire.

Download Presentation

Please find below an Image/Link to download the presentation.
The content on the website is provided AS IS for your information and personal use only. It may not be sold, licensed, or shared on other websites without obtaining consent from the author. Download presentation by click this link. If you encounter any issues during the download, it is possible that the publisher has removed the file from their server.
E N D
Presentation Transcript
v Buckinghamshire Business Barometer October 2022
Introduction The Buckinghamshire Business Barometer is a quarterly survey of Buckinghamshire businesses run by Buckinghamshire Local Enterprise Partnership and Buckinghamshire Business First. It was established in January 2021 as a means of: Tracking local business confidence and performance as the economy emerges from the shock of the Covid-19 pandemic Gauging local businesses views on topical issues. This report presents the findings of the sixth survey which ran between August and October 2022, with respondents answering questions about the April to June (Quarter 2) 2022 period. Every quarter, the survey findings are shared directly with the Department for Business, Energy and Industrial Strategy (BEIS) to help inform central government policy decisions.
Key findings The second quarter of 2022 brought a substantial negative change on trading conditions and business performance for respondents, undoing some of the progress achieved following the end of Covid restrictions. Chart 1: Compared to normal for this time of year, how would you describe current trading conditions for your business? 4% More than half (54%) of those responding to the Quarter 2 2022 (Q2) Buckinghamshire Business Barometer survey described trading conditions between April and June as worse than normal for the time of year (chart 1). This is up from just under a quarter (24%) of those saying the same for the previous quarter. 16% 27% 27% 22% 31% 34% 30% A marked fall was seen in sales and order books/pipelines in the second quarter of 2022 (+1%) compared to the previous quarter (+32%). Profits this quarter (-37%) dropped compared to last quarter (-11%) and remain negative. This is likely due to costs remaining high, albeit with a slight improvement in net balance score (+64%) compared to the previous quarter (+77%). 24% 39% 44% 42% This quarter we asked Buckinghamshire businesses about areas where they are seeing rising business costs and their severity. All 67 businesses that responded to the survey experienced a rise in business costs in at least one of the 13 areas identified. More than half (57%) experienced rising business costs in at least 6 or more areas. 74% 54% 45% 34% 30% 24% In terms of the severity of those business cost increases, energy and goods/materials stood out as particular concerns. Furthermore, the severity of business cost increases for areas such as energy and goods/materials have become substantially worse in less than a year (when compared to data for Q3 2021). 2021 Q1 2021 Q2 2021 Q3 2021 Q4 2022 Q1 2022 Q2 Worse than normal About normal Better than normal The impact of the increased severity of business costs will translate into price increases for the goods and services provided by the majority of respondents, the greatest proportion of which having implemented, or intend to implement sustainable long-term price increases for 12 months or longer. Base for Q2 2022: all respondents (67)
Hows business? Situation in April 2022 June 2022. 1. Sales have / custom has... 2. Order book / pipeline has The six dials to the left indicate how businesses performed between January and March 2022. The figures presented are net balance scores. The net balance score is the percentage of firms reporting an increase minus the percentage reporting a decrease. For example, if 15% of firms told us their sales increased and 65% said their sales decreased, the balance for the quarter would be -50%. Alternatively, if 50% report profits have increased, and 10% report profits have decreased, the balance would be +40%. With the exception of costs, negative figures indicate a contraction and positive figures indicate growth. +1% -4% 3. Costs have 4. Turnover has... The net balance business performance scores for Q2 2022 shows a marked negative change across all net balance score indicators compared to last quarter, except costs which improved slightly but remains elevated. For comparison, falls were seen in sales (from +32% in Q1 2022 to +1% in Q2 2022), turnover (from +23% to -1% in Q2 2022) and order books/pipelines (from +32% to -4% in Q2 2022). Profits dropped from -11% to -37% in Q2 2022. +64% -1% 6. Workforce has... 5. Profits have... A reason for this continues to be the poor net balance score of +64% for costs, down slightly from +77% the previous quarter, but remains significantly higher than the +1% recorded in the first quarter of 2021. Costs have remained high during this period for many firms for a variety of reasons, including inflationary pressures, continuing supply chain disruption, staff shortages, loan repayments and rising energy/fuel costs. -6% -37% Base: all respondents (67)
Hows business? Situation over the last 12 months. For the significant majority of respondents (78%), reducing costs has been a greater priority over the last 12 months. This is considerably higher than other priorities identified, and highlights the increasing severity of rising costs for local businesses. Chart 2: Have any of the following become more or less of a priority over the last 12 months? Reducing costs To some extent, as a consequence for the need to reduce costs, areas such as reducing environmental impact and undertaking research and development most notably, have become less important for a relatively high proportion of businesses compared to previous quarterly surveys. Introducing new processes Collaborating with other businesses / organisations Entering new markets In addition, areas that focus on business growth such as introducing new processes, entering new markets and introducing new digital technologies are more important for under half of respondents. Introducing new digital technologies Introducing new products / services Developing skills (management and/or employees) To further emphasise the changing outlook for businesses, all net balance scores* across all areas (except reducing costs and reducing environmental impact) are the lowest recorded across all quarterly surveys since Q1 2021, during which the country was in its third national lockdown. Reducing environmental impact Undertaking research and development 0% 10% 20% 30% 40% 50% 60% 70% 80% 90% Less important More important *net balance score refers to the percentage of firms reporting an area being more important minus the percentage reporting less important. Base: all respondents (67)
Spotlight business costs Due to a variety of significant and ongoing national and global issues, rising business costs remain a critical issue for businesses in Buckinghamshire and beyond. This quarter we therefore asked respondents about areas where they are seeing rising business costs and their severity. Chart 3: Number of areas respondents have experienced cost increases. 21% Thirteen areas have been identified where rising business costs are an issue. All 67 businesses that responded to the survey experienced a rise in business costs in at least one of the 13 areas identified. 13% 13% 12% experienced rising business costs in at least 6 or more areas 10% 57% 7% 7% 4% 3% 3% 3% experienced rising business costs in 6 areas 1% 1 in 5 0% 0% 0 1 2 3 4 5 6 7 8 9 10 11 12 13 areas areas experienced rising business costs in 9 areas 1 in 10 Base: all respondents (67)
Spotlight business costs Chart 4: In recent months, to what extent have you experienced cost increases in the following areas? The proportion of respondents that experienced increased business costs outweighed those that did not experience an increase across all 13 areas where applicable. Increase No increase As shown in Chart 4, four areas recorded increases from more than half of respondents. These are energy (90%), goods/materials (81%), transportation (within the UK) (73%) and staff wages (61%). 100% 90% 90% 81% 73% 80% 70% 61% 60% A significant contrast was also seen between the proportion of respondents that did (39%), and did not (3%), experience increased business costs related to the prices of goods and services imported where applicable. This is likely to be due to a combination of factors including Brexit, ongoing supply chain issues and the relatively more recent weak value of the pound making imports more expensive for UK businesses. 50% 42% 42% 39% 37% 34% 40% 31% 24% 25% 30% 20% 7% 10% 0% The impact of Brexit is also contributing to increased business costs to an extent in areas such as increased red tape (42%), extra tariffs or taxes (31%), transportation (importing and exporting goods) (25%), changing supply chains (24%) and setting up EU subsidiaries (7%). Of concern is also the 34% of respondents that experienced increased business costs in relation to debt repayments. This could be exacerbated further if interests rates continue to rise. 37% of respondents also experienced increased business costs for recruitment, which is further evidence highlighting ongoing recruitment difficulties for local businesses. Base: all respondents (67)
Spotlight business costs Chart 5: In recent months, to what extent have you experienced cost increases in the following areas? Severity of cost increases In terms of the severity of business cost increases, more than half (61%) of respondents experienced a large increase in energy costs. This is considerably higher than the 19% of respondents in Quarter 3 (July to September) 2021 that reported a large increase in energy costs. Energy 61% 19% 9% Goods / materials 43% 28% 9% Transportation (within the UK) 30% 25% 18% Staff wages 18% 24% 19% As a result, despite 75% of respondents in Q3 2021 reporting increased energy costs, the severity of that increase has become substantially worse in less than a year. Increased red tape 13% 13% 15% Staff training 6% 16% 19% One would hope that the recently announced Energy Bill Relief Scheme, which provides discounts to energy usage for businesses between 1 October 2022 and 31 March 2023, will help to alleviate some of the energy cost pressures. Prices of goods and services imported 19% 15% Recruitment 16% 7% 13% Debt repayment 7% 16% 10% Extra tariffs or taxes 12% 9% 10% A significant increase in the severity of cost increases was also reported for: Transportation (importing and exporting goods) 13% 9% Goods/materials (17% reporting large increase in Q3 2021 to 43% in Q2 2022). Transportation within the UK (9% to 30%) Staff wages (7% to 18%) Changing supply chains 6% 10% 7% Setting up EU subsidiaries Large increase Moderate increase Small increase Base: all respondents (67)
Spotlight business costs Chart 6: If you have experienced increased costs in recent months, what has been the impact on the prices you sell at? Impact on prices And/or what do you anticipate will be the impact over the coming months? The impact of the increased severity of business costs will translate into price increases for the goods and services provided by the majority of respondents. Sustainable long-term (12 months +) price increases 34% More than three quarters (77%) of respondents increased, or anticipate to increase, their prices. This is up from 53% of respondents that said the same in the Q3 2021 Buckinghamshire Business Barometer. Sustainable (6-12 months) price increases 13% Worryingly, of the respondents that have, or intend to increase their prices, 44% (or 34% of all respondents) described their price increases as sustainable long- term price increases for 12 months or longer. Sustainable short-term (0-6 months) price increases 30% No price increases (at present or anticipated) 22% Base: all respondents (67)
Over the last month, how did your business's debt repayments compare with Spotlight debt repayments Chart 7: turnover? 16% Not sure 45% No repayments Debt repayments have also increased for just over a third (34%) of respondents. As a proportion of turnover however, and for the majority of respondents that have debt repayments, it sits below 20% of their turnover. 30% Up to 20% of turnover 6% Between 20% and 50% of turnover 3% Between 50% and 100% of turnover A smaller proportion of respondents said debt repayments were between 20% and 50% of turnover (6%), along with those reporting between 50% and 100% of turnover (3%). 0% More than 100% of turnover The results for this quarter are broadly in-line with results reported for Quarter 3 in 2021. In addition, 42% of respondents reported their business debt repayments stayed the same when compared to normal expectations for this time of year, whilst 16% reported an increase. Again, rather encouragingly this is broadly in-line with Quarter 3 2021 results. Chart 8: normal expectations for this time of year? sure Not 42% 0% More than 50% Decreased However, when factoring in the increased severity of other business costs for the majority of businesses compared to Quarter 3 2021, debt repayments could become a more concerning issue for those applicable. 0% Between 20% and 50% 0% Up to 20% It is also worth bearing in mind that the base interest rate set by the Bank of England is expected to increase further, which could pass on added costs for businesses. Stayed same the 42% 12% Up to 20% Increased 1% Between 20% and 50% Base: all respondents (67) 3% More than 50%
Looking ahead.. Chart 9: Over the next three months do you intend to The Barometer findings regarding plans for the next three months are in clear contrast to the encouraging improvements shown for the previous quarter, thereby reflecting the future uncertainty for Buckinghamshire businesses. Yes No 100% 90% For instance, 55% of respondents intend to invest in marketing/advertising over the next three months. This is down from 76% the previous quarter. 80% 70% 60% Similar negative changes are reported across the majority of areas, the largest of which being a halving in the proportion of respondents intending to invest in equipment and machinery (48% in Q1 2022 to 24% in Q2 2022). Of concern is also the 10% of respondents that intend to decrease their headcount in the next three months. This is up from 3% of respondents from the previous quarter. 50% 40% 30% 55% 48% 20% 37% 34% 24% 24% 22% 10% 19% 18% 10% 10% 6% 0% Despite this, 34% intend to increase their headcount, however this is down from more than half (53%) of respondents from the previous quarter. Base: all respondents (67)
Methodology Background The Buckinghamshire Business Barometer is run by Buckinghamshire Local Enterprise Partnership (Bucks LEP) and Buckinghamshire Business First (BBF). The Barometer began in 2021 and is conducted via an online survey on a quarterly basis. The survey can be completed by any business operating within Buckinghamshire and is promoted to businesses through BBF and its partners. Respondents are self-selecting and the results are not weighted, therefore the findings should be treated as indicative rather than representative of all Buckinghamshire businesses. The first Barometer survey (Q1 2021) was conducted between January and March 2021. The next survey (Q2 2021) was conducted between July and August 2021, with survey respondents being asked about the April to June (Q2) 2021 period. The Q3 2021 survey was conducted between October and November, with questions concerning the July to September (Q3) 2021 period. The Q4 2021 survey was conducted between late January and March 2022, with questions concerning the October to December (Q4) 2021 period. The Q1 2022 survey was conducted between May and June 2022, with questions concerning the January to March (Q1) 2022 period. The Q2 2022 survey was conducted between August and October, with questions concerning the April to June (Q2) 2022 period. The next survey (Q3 2022) will be conducted in October/November 2022. Net balance scores Some Barometer findings are presented as net balance scores (see slide 4). The net balance scores are the percentage of firms reporting an increase minus the percentage reporting a decrease. For example, if 15% of firms told us their sales increased and 65% said their sales decreased, the balance for the quarter would be - 50% (an overall contraction). Alternatively, if 50% report profits have increased, and 10% report profits have decreased, the balance would be +40% (an overall expansion). This method is used by other business tracking surveys, including the British Chamber of Commerce Quarterly Economic Survey. Survey respondents (Q2, 2022) A total of 67 Buckinghamshire businesses responded to the Q2 2022 Buckinghamshire Business Barometer. The majority of respondents operate in the service sector (85%) with the remainder (15%) operating in the non-service sector (e.g. agriculture, forestry, manufacturing, construction, printing). The majority of respondents were micro businesses, with 63% employing fewer than five people. One of the respondents were large (employing more than 100 people) and 36% employ between 6 and 50 people. Whilst the proportions are not like for like to Buckinghamshire s business population as a whole, it is still relatively representative. Buckinghamshire s business population comprises of 78% micro firms, 20% small firms (6-50 employees), and 2% medium and large firms employing more than 50 people. Responses were received from businesses operating across the County.
Contact details For further information about the Buckinghamshire Business Barometer For further information about Buckinghamshire Business First James Moorhouse Economic and Labour Market Analyst Buckinghamshire LEP 01494 418415 james.moorhouse@buckslep.co.uk Buckinghamshire Business First Claydon House 1 Edison Road Rabans Lane Industrial Area Aylesbury HP19 8TE 01494 927130 For Business advice - BusinessSupport@bbf.uk.com For Membership advice - Membership@bbf.uk.com For General Enquires - Info@bbf.uk.com