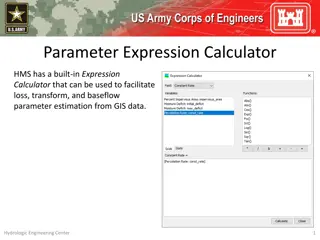
GridPIQ Web Calculator for Grid Project Impact Quantification

Explore the Grid Project Impact Quantification Tool (GridPIQ) for assessing impacts of grid projects, visualizing time series, comparing assumptions, and more. Quickly input data and analyze scenarios for energy storage, PV, emissions, and peak power impacts using this intuitive online tool.

Download Presentation

Please find below an Image/Link to download the presentation.
The content on the website is provided AS IS for your information and personal use only. It may not be sold, licensed, or shared on other websites without obtaining consent from the author. Download presentation by click this link. If you encounter any issues during the download, it is possible that the publisher has removed the file from their server.
E N D
Presentation Transcript
Introducing the Grid Project Impacts Quantification Web Calculator 28 August 2018 Presented by: Pacific Northwest National Laboratory (Karen Studarus) gridpiq.pnnl.gov PNNL-SA-137754
If Only I Could Quickly and Easily Ask many what if? questions about my system Screen grid projects Visualize grid time series Compare assumptions Sanity check results Check for knock-on benefits or unintended consequences Document benefits of my project or product Leverage many data sources in one place
Introducing the Grid Project Impact Quantification Tool (GridPIQ) Screening tool for grid projects various technologies (e.g. energy storage, PV) and impacts (e.g. inter-hour ramping, emissions, peak power) Publically available right now gridpiq.pnnl.gov Transparent methodologies and data sources Built in online instructions and explanation of methodology Intuitive user interface
How does it work? User inputs a few simple things to see results in seconds For example: Technology type, efficiency, size, location Completely customizable Change parameters to 1. explore assumptions, 2. compare scenarios, or 3. tune the results to your specific location for maximum applicability User cautioned when boundaries of the GridPIQ model are pushed We ll show two examples today: New control scheme on a distribution feeder Energy Storage
Use Case and Demo: Amplify your own analysis You have deployed a project on a distribution feeder and measured hourly power time series (MW) You ve already got a scenario and would like to do quick screening or sanity check of results Report additional insight Changes fuel costs Changes ramp rates Changes emissions Changes energy usage etc Your Analysis Before + after Hourly .csv Power Upload data, define context GridPIQ Results
Use Case and Demo: Energy Storage Characteristics you input: Battery size, location characteristics, dispatch objective Expect Insight about how the battery changes the system s: Net Load Profile (MW) Energy consumption Peak Power Ramping requirement from other generators Carbon footprint Etc. Now let me step you through
Overview of Available Technologies
Conservation Voltage Reduction (CVR) Hourly percent reduction (or increase) in power due to implementation of CVR Typical hourly profiles using data from PNNL Report: Evaluation of Conservation Voltage Reduction on a National Level KP Schneider, JC Fuller, FK Tuffner, R Singh
Energy Storage Market Participation Operate storage to maximize profit Input prices Discover operating profile and consequences Based on PNNL work: D Wu, C Jin, P Balducci, M Kintner-Meyer Daily Peak Shaving Operate storage to peak shave and valley fill Quadratic program developed by Emily Barrett Annual Peak Shaving Operate storage to reduce annual peak to specified level Discover requisite battery sizing
Photovoltaics Upload PV generation profile, or model PV output Modeling directly uses NREL s PV Watts, part of the System Advisor Model
Electric Vehicle Coordinated Charging Use typical charging behavior to compare with coordinated charging Charging data from Idaho National Laboratory s EV Project
Virtual Battery Use residential loads like water heaters for demand response, modeled as a battery Estimate how much capacity is available in your region or county Virtual battery formulation from PNNL work: Optimal Coordination of Building Loads and Energy Storage for Power Grid and End User Services H Hao, D Wu, J Lian, T Yang
GridPIQ 2.0 Enable different tech combos Choice of results Improved mobile design Quicker/improved Performance More options for customizing scenarios
Get involved! Contact us if you d like to join the GridPIQSteering Committee. Meet once a year to influence future development of the project, check progress, and make sure GridPIQ meets your needs Use the calculator: GridPIQ.pnnl.gov Partner for analysis Incorporate your methodology or tool with GridPIQ News about this and other Advanced Grid Research on SmartGrid.gov gridpiq@pnnl.gov, 206-528-3487


")