Energy Statistics in Denmark 2022 - Insights from Danish Energy Agency


E
n
e
r
g
y
S
t
a
t
i
s
t
i
c
s
i
n
D
e
n
m
a
r
k
2022
Danish Energy Agency
Side 1

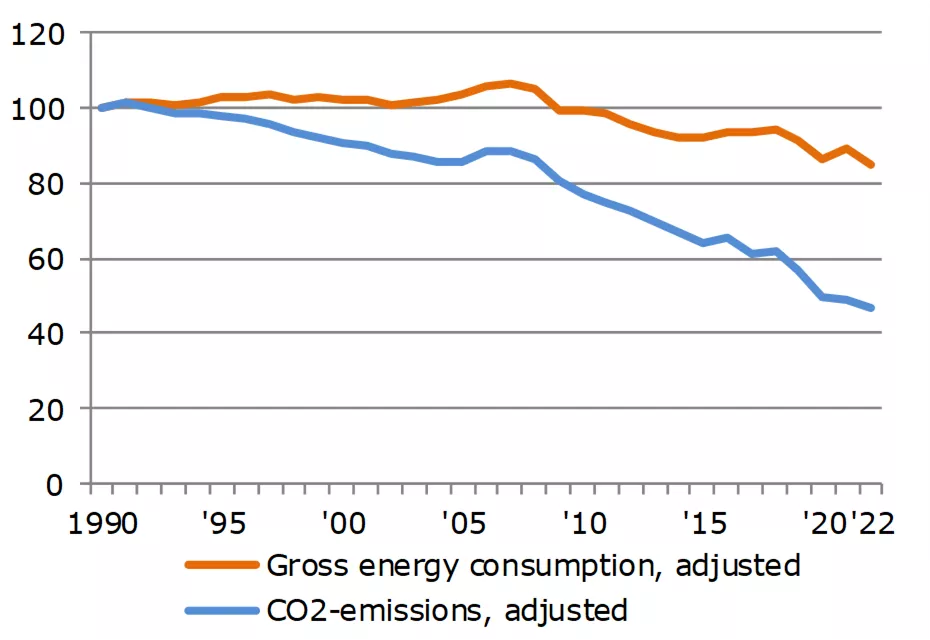
Gross energy consumption
and emissions of CO
2
Danish Energy Agency
Side 2
A
d
j
u
s
t
e
d
Index 1990=100
Degree of self-sufficiency
Danish Energy Agency
Side 3
Primary energy production
Danish Energy Agency
Side 4
PJ
Oil and gas reserves/resources
Danish Energy Agency
Side 5
Natural gas consumption and flaring
on platforms in the North Sea
Danish Energy Agency
Side 6
PJ
Production of renewable
energy by energy product
Danish Energy Agency
Side 7
PJ
Consumption of waste
Danish Energy Agency
Side 8
PJ
Consumption of renewable energy
Danish Energy Agency
Side 9
PJ
Renewable energy –
consumption by energy product
Danish Energy Agency
Side 10
PJ
Use of renewable energy in
2022
Danish Energy Agency
Side 11
PJ
Renewable energy - share of
total energy consumption
Danish Energy Agency
Side 12
%
Share of renewable energy according
to the EU method of calculation
Danish Energy Agency
Side 13
%
Wind power capacity and wind power’s
share of domestic electricity supply
Danish Energy Agency
Side 14
MW
Danish Energy Agency
Side 15
Wind power onshore by
municipality 2022
Wind power capacity by
turbine size
Danish Energy Agency
Side 16
MW
Wind power production by
turbine size
Danish Energy Agency
Side 17
TJ
Electricity production by type
of producer
Danish Energy Agency
Side 18
PJ
Electricity production by fuel
Danish Energy Agency
Side 19
PJ
Other fuels than coal for
electricity production
Danish Energy Agency
Side 20
Net exports of electricity by
country
Danish Energy Agency
Side 21
PJ
Electricity capacity
Danish Energy Agency
Side 22
MW
CHP share of thermal power
and district heating production
Danish Energy Agency
Side 23
Heat supply 2022
by type of
primary fuel
Danish Energy Agency
Side 24
%
District heating production by
type of production plant
Danish Energy Agency
Side 25
PJ
Fuel consumption for district heating
production, percentage distribution
Danish Energy Agency
Side 26
Observed energy consumption and
adjusted gross energy consumption
Danish Energy Agency
Side 27
PJ
Gross energy consumption by fuel
Danish Energy Agency
Side 28
PJ
A
d
j
u
s
t
e
d
Gross energy consumption by
energy product after transformation
Danish Energy Agency
Side 29
PJ
A
d
j
u
s
t
e
d
Gross energy consumption by use
Danish Energy Agency
Side 30
PJ
A
d
j
u
s
t
e
d
Final energy consumption by use
Danish Energy Agency
Side 31
PJ
C
l
i
m
a
t
e
-
a
d
j
u
s
t
e
d
Final energy consumption by
energy product
Danish Energy Agency
Side 32
PJ
C
l
i
m
a
t
e
-
a
d
j
u
s
t
e
d
Gross energy consumption and final
energy consumption per DKK million GDP
Danish Energy Agency
Side 33
TJ per DKK million GDP (2010 prices, chained values)
Final electricity consumption
by use
Danish Energy Agency
Side 34
C
l
i
m
a
t
e
-
a
d
j
u
s
t
e
d
PJ
Electricity consumption’s share of
total energy consumption
Danish Energy Agency
Side 35
%
Climate-adjusted
Energy consumption for transport
by type
Danish Energy Agency
Side 36
PJ
Energy consumption for transport
by fuel type
Danish Energy Agency
Side 37
PJ
Energy consumption for road
transport
Danish Energy Agency
Side 38
Final energy consumption by
passengers and freight transport
Danish Energy Agency
Side 39
PJ
Danish Energy Agency
Side 40
PJ
Energy consumption for passengers
transport by means of transport
Danish Energy Agency
Side 41
PJ
Energy consumption for freight
transport by means of transport
Danish Energy Agency
Side 42
PJ
Energy and electricity consumption in
agriculture and industry
Climate-adjusted
Danish Energy Agency
Side 43
PJ
Energy consumption in agriculture
and industry by energy product
Climate-adjusted
Danish Energy Agency
Side 44
PJ
Energy consumption by individual industry
in the agriculture and industry sector
Climate-adjusted
Danish Energy Agency
Side 45
Electricity consumption’s share of total
energy consumption
Climate-adjusted
Danish Energy Agency
Side 46
PJ
Energy and electricity consumption in
manufacturing industry
Climate-adjusted
Danish Energy Agency
Side 47
Composition of energy consumption
in manufacturing industries
Climate-adjusted
Danish Energy Agency
Side 48
Climate-adjusted
Energy intensities in agriculture and
industry
TJ per million DKK GVA (2010 prices, chained values)
Danish Energy Agency
Side 49
Electricity intensities in agriculture
and industry
Climate-adjusted
TJ per million DKK GVA (2010 prices, chained values)
Danish Energy Agency
Side 50
Energy consumption per employee in
manufacturing industry
Climate-adjusted
GJ per
employee
Danish Energy Agency
Side 51
PJ
Energy and electricity consumption in
the commercial and public services
Climate-adjusted
Danish Energy Agency
Side 52
PJ
Climate-adjusted
Energy consumption by energy
product
Danish Energy Agency
Side 53
Composition of energy consumption
in commercial and public services
Climate-adjusted
Danish Energy Agency
Side 54
PJ
Energy consumption by sector
Climate-adjusted
Danish Energy Agency
Side 55
PJ
Energy consumption for heating in
the commercial and public services
Climate-adjusted
Danish Energy Agency
Side 56
PJ
Electricity consumption by sector
Climate-adjusted
Danish Energy Agency
Side 57
Energy intensities in the commercial
and public services
TJ per DKK million GVA (2010 prices, chained values)
Climate-adjusted
Danish Energy Agency
Side 58
Electricity intensities in commercial
and public services
TJ per DKK million GVA (2010 prices, chained values)
Climate-adjusted
Danish Energy Agency
Side 59
Energy consumption per employee in
the commercial and public services
Climate-adjusted
GJ per employee
Danish Energy Agency
Side 60
PJ
Energy consumption in households
Danish Energy Agency
Side 61
PJ
Household consumption by energy
types
Climate-adjusted
Danish Energy Agency
Side 62
GJ
Energy consumption per household
Climate-adjusted
Danish Energy Agency
Side 63
Heating installations in dwellings
1000 units
Danish Energy Agency
Side 64
Energy consumption for heating in
dwellings
Climate adjusted
Index 1990=100
Danish Energy Agency
Side 65
PJ
Net energy consumption and
heat loss for heating in dwellings
Climate-adjusted
Danish Energy Agency
Side 66
Index 1990=100
Private consumption and electricity
consumption in households
Danish Energy Agency
Side 67
Household stock of electrical
appliances
1000 units
Danish Energy Agency
Side 68
Specific electricity consumption
of household appliances
kWh/year
Danish Energy Agency
Side 69
CO
2
emissions from energy
consumption
Million tonnes CO
2
Danish Energy Agency
Side 70
CO
2
emissions by fuel
Adjusted
Million tonnes CO
2
Danish Energy Agency
Side 71
CO
2
emissions per fuel unit and per
kWh electricity
Adjusted
Kilogram per GJ
Gram per kWh
Danish Energy Agency
Side 72
Observed CO
2
emissions by sector
Million tonnes CO
2
Danish Energy Agency
Side 73
CO
2
emissions in end-use of energy
Climate-adjusted
Million tonnes CO
2
Danish Energy Agency
Side 74
Emissions of greenhouse gases
Million tonnes CO
2
equivalents
Danish Energy Agency
Side 75
Total observed emissions from
greenhouse gases distributed by
origin 2021
* Waste deposit etc.: Waste deposit,
Sewage treatment, Other waste and
Indirect CO2-emissions
Danish Energy Agency
Side 76
Observed net-emissions of green-
house gases by origin
Million tonnes CO
2
equivalents
* Waste deposit etc.: Waste deposit,
Sewage treatment, Other waste and
Indirect CO2-emissions
Danish Energy Agency
Side 77
Observed CO
2
emissions from energy
consumption in 2022, EU ETS and non-
EU ETS sectors
1000 tonnes
Danish Energy Agency
Side 78
Energy expenses by industry and
households
DKK Billion, current prices
Danish Energy Agency
Side 79
Energy expenses in agriculture and
industry
DKK Billion, current prices
Danish Energy Agency
Side 80
Energy expenses by fuel
DKK Billion, current prices
Danish Energy Agency
Side 81
Revenue from energy, CO
2
and
sulphur taxes
DKK Billion, current prices
Danish Energy Agency
Side 82
Energy expenditures and tax
revenues, fixed prices
Billion DKK, 2021 prices
Danish Energy Agency
Side 83
Value of crude oil and natural gas
production
Billion DKK, current prices
Danish Energy Agency
Side 84
Exports of energy technology and
equipment
Billion DKK, current prices
Danish Energy Agency
Side 85
Spot market prices of crude oil
USD per barrel, annual average
*Prices for 2022 cover only the first six months.
CO
2
-prices
Danish Energy Agency
Side 86
EUR/tonne
Danish Energy Agency
Side 87
Spot market prices for electricity
DKK 0.01 per kWh
Danish Energy Agency
Side 88
Energy prices for households
DKK, current prices
Danish Energy Agency
Side 89
Energy prices for households
DKK, 2022 prices
Danish Energy Agency
Side 90
Electricity prices, excl. taxes for
industrial customers
DKK per KWh
Source: Eurostat
Danish Energy Agency
Side 91
Natural gas prices, excl. taxes for
industrial customers
DKK per m
3
Source: Eurostat
Danish Energy Agency
Side 92
Motor gasoline prices
DKK per litre
Source: Oil Bulletin, European Commission
Danish Energy Agency
Side 93
Composition of energy prices for
households
Danish Energy Agency
Side 94
Electricity prices for households*
1997-2022 (1 January)
DKK 0.01 per kWh
*Annual consumption of 4000 kWh
Danish Energy Agency
Side 95
Natural gas prices for households
2018H1-2022H1
DKK per m
3
Danish Energy Agency
Side 96
Consumption of renewable
energy
Exajoules
Danish Energy Agency
Side 97
Million tonnes
Oil consumption by region
Danish Energy Agency
Side 98
Energy consumption by region
Million tonnes oil equivalents
Explore the latest data on energy consumption, CO2 emissions, self-sufficiency, primary energy production, oil and gas reserves, renewable energy, waste consumption, and more in Denmark for the year 2022. The report provides detailed information on various aspects of Denmark's energy landscape, highlighting trends and developments over the years.

Download Presentation

Please find below an Image/Link to download the presentation.
The content on the website is provided AS IS for your information and personal use only. It may not be sold, licensed, or shared on other websites without obtaining consent from the author. Download presentation by click this link. If you encounter any issues during the download, it is possible that the publisher has removed the file from their server.
E N D
Presentation Transcript
Energy Statistics in Denmark 2022 Danish Energy Agency Side 1
Gross energy consumption and emissions of CO2 Adjusted Index 1990=100 120 100 80 60 40 20 0 1990 '95 '00 '05 '10 '15 '20'22 Gross energy consumption, adjusted CO2-emissions, adjusted Danish Energy Agency Side 2
Degree of self-sufficiency 250% 200% 150% 100% 50% 0% 1990 '95 '00 '05 '10 '15 '20'22 Total energy Oil Danish Energy Agency Side 3
Primary energy production PJ 1400 1200 1000 800 600 400 200 0 1990 '95 '00 '05 '10 '15 '20'22 Oil Natural gas Renewable energy and waste Danish Energy Agency Side 4
Oil and gas reserves/resources 350 300 250 200 150 100 50 0 '95 Crude oil, million m3 '05 '07 '09 '11 '13 '15 '17 Gas, billion Nm3 '18 '19 '20 '21 '00 '22 1990 Danish Energy Agency Side 5
Natural gas consumption and flaring on platforms in the North Sea PJ 40 30 20 10 0 1990 '95 '00 '05 '10 '15 '20'22 Energy consumption Flaring Danish Energy Agency Side 6
Production of renewable energy by energy product PJ 250 200 150 100 50 0 1990 '95 Wind Wood Waste, renewable '00 '05 '10 '15 '20'22 Straw Biogas Heat pumps etc. Danish Energy Agency Side 7
Consumption of waste PJ 45 40 35 30 25 20 15 10 5 0 1990 '95 '00 '05 '10 '15 '20'22 Waste, renewable Waste, non-renewable Danish Energy Agency Side 8
Consumption of renewable energy PJ 300 250 200 150 100 50 0 1990 '95 '00 '05 '10 '15 '20'22 Share covered by net imports Production of renewable energy Danish Energy Agency Side 9
Renewable energy consumption by energy product PJ 200 180 160 140 120 100 80 60 40 20 0 1990 '95 '00 '05 '10 '15 '20'22 Wind Biomass Biogas Others Danish Energy Agency Side 10
Use of renewable energy in 2022 PJ 220 200 180 160 140 120 100 80 60 40 20 0 Electricity and district heating Wind Wood Waste, renewable Final consumption Straw Biogas Other renewables Danish Energy Agency Side 11
Renewable energy - share of total energy consumption % 45 40 35 30 25 20 15 10 5 0 1990 '95 '00 '05 '10 '15 '20'22 Share of observed energy consumption Share of adjusted gross energy consumption Danish Energy Agency Side 12
Share of renewable energy according to the EU method of calculation % 45 40 35 30 25 20 15 10 5 0 1990 '95 '00 '05 '10 '15 '21 Share of renewable energy 2020 Target for share of renewable energy Danish Energy Agency Side 13
Wind power capacity and wind powers share of domestic electricity supply MW 8000 60% 7000 50% 6000 40% 5000 4000 30% 3000 20% 2000 10% 1000 0 0% 1990 '95 '00 '05 '10 '15 '20 '22 Wind power offshore capacity, MW Wind power onshore capacity, MW Wind power's share of domestic electricity supply, % Danish Energy Agency Side 14
Wind power onshore by municipality 2022 Danish Energy Agency Side 15
Wind power capacity by turbine size MW 8000 7000 6000 5000 4000 3000 2000 1000 0 1990 - 499 kW 1000 - 1999 kW 2000 2010 2021 2022 500 - 999 kW 2000 - kW Danish Energy Agency Side 16
Wind power production by turbine size TJ 80000 70000 60000 50000 40000 30000 20000 10000 0 1990 - 499 kW 1000 - 1999 kW 2000 2010 2021 2022 500 - 999 kW 2000 - kW Danish Energy Agency Side 17
Electricity production by type of producer PJ 200 150 100 50 0 1990 '95 Large-scale power units Large-scale CHP units Small-scale CHP units Autoproducers Wind turbines and hydro power units '00 '05 '10 '15 '20'22 Danish Energy Agency Side 18
Electricity production by fuel PJ 200 150 100 50 0 1994 '00 Other renewable energy etc. Wind Natural gas Oil Coal '05 '10 '15 '20'22 Danish Energy Agency Side 19
Other fuels than coal for electricity production 90% 80% 70% 60% 50% 40% 30% 20% 10% 0% 1990 '95 '00 '05 '10 '15 '20'22 Oil Natural gas Renewable energy etc. Danish Energy Agency Side 20
Net exports of electricity by country PJ 60 50 40 30 20 10 0 -10 -20 -30 -40 1990 '95 '00 '05 '10 '15 Norway '20'22 Total Sweden Germany Netherlands Danish Energy Agency Side 21
Electricity capacity MW 20.000 16.000 12.000 8.000 4.000 0 '95 '00 '05 '10 '15 '20'22 Large-scale units Autoproducers Solar Small-scale units Wind turbines Danish Energy Agency Side 22
CHP share of thermal power and district heating production 100% 80% 60% 40% 20% 0% 1990 '95 '00 '05 '10 '15 '20'22 District heating Electricity Danish Energy Agency Side 23
Heat supply 2022 by type of primary fuel % 70 60 50 40 30 20 10 0 CHP units District heating Coal Natural gas Waste Biomass Others Danish Energy Agency Side 24
District heating production by type of production plant PJ 160 140 120 100 80 60 40 20 0 1990 '95 '00 '05 '10 '15 '20'22 Large-scale CHP units Small-scale CHP units District heating units Autoproducers, CHP Autoproducers, heat only Danish Energy Agency Side 25
Fuel consumption for district heating production, percentage distribution 100% 80% 60% 40% 20% 0% 1990 '95 '00 '05 '10 '15 '20'22 Electricity for heat pumps, electric boilers Renewable energy Waste, non-renewable Coal Natural gas Oil Danish Energy Agency Side 26
Observed energy consumption and adjusted gross energy consumption PJ 1000 900 800 700 600 1990 '95 '00 '05 '10 '15 '20'22 Observed consumption Adjusted consumption Danish Energy Agency Side 27
Gross energy consumption by fuel Adjusted PJ 900 800 700 600 500 400 300 200 100 0 1990 '95 '00 '05 '10 '15 '20'22 Oil Natural gas Coal and coke Renewable energy etc. Danish Energy Agency Side 28
Gross energy consumption by energy product after transformation Adjusted PJ 900 600 300 0 1990 '95 '00 '05 '10 Natural gas Renewable energy etc. District heating '15 '20'22 Oil Coal and coke Electricity Gas works gas Danish Energy Agency Side 29
Gross energy consumption by use Adjusted PJ 900 600 300 0 1990 '95 '00 '05 '10 '15 '20'22 Households Commercial and public services Agriculture and industry Transport Non-energy use Energy sector Danish Energy Agency Side 30
Final energy consumption by use Climate-adjusted PJ 250 200 150 100 50 0 Non-energy use Transport Agriculture and industry Commercial and public services Households 1990 2000 2010 2020 2021 2022 Danish Energy Agency Side 31
Final energy consumption by energy product PJ 700 Climate-adjusted 600 500 400 300 200 100 0 1990 '95 '00 '05 '10 Natural gas Renewable energy District heating '15 '20'22 Oil Coal and coke Electricity Gas works gas Danish Energy Agency Side 32
Gross energy consumption and final energy consumption per DKK million GDP TJ per DKK million GDP (2010 prices, chained values) 1,0 0,8 0,6 0,4 0,2 0,0 1990 '95 '00 '05 '10 '15 '20'22 Gross energy consumption, adjusted Final energy consumption, climate adjusted Danish Energy Agency Side 33
Final electricity consumption by use Climate-adjusted PJ 45 40 35 30 25 1990 '95 '00 '05 '10 '15 '20'22 Manufacturing, industry Commercial and public services Households Danish Energy Agency Side 34
Electricity consumptions share of total energy consumption Climate-adjusted % 50 40 30 20 10 0 1990 '95 '00 '05 '10 '15 '20'22 Total Manufacturing, industry Commercial and public services Households Others Danish Energy Agency Side 35
Energy consumption for transport by type PJ 250 200 150 100 50 0 1990 '95 '00 '05 '10 '15 '20'22 Road Domestic sea transport International aviation Rail Domestic aviation Military transport Danish Energy Agency Side 36
Energy consumption for transport by fuel type PJ 250 200 150 100 50 0 1990 '95 '00 '05 '10 '15 '20'22 Other fuels Aviation fuels Diesel oil incl. biodiesel Motor gasoline incl. bioethanol Danish Energy Agency Side 37
Energy consumption for road transport 90% 80% 70% 60% 50% 40% 30% 20% 10% 0% 1990 '95 '00 '05 '10 '15 '20'22 Road transport, share of total energy consumption for transport Diesel oil incl. biodiesel, share of total energy consumption for road transport Danish Energy Agency Side 38
Final energy consumption by passengers and freight transport PJ 250 200 150 100 50 0 1990 Transport of freight Military transport '95 '00 '05 '10 Transport of passengers '15 '20'22 Danish Energy Agency Side 39
Energy consumption for passengers transport by means of transport PJ 180 160 140 120 100 80 60 40 20 0 1990 '95 Domestic sea transport International aviation Domestic aviation Train, S-train and metro Two-wheeled (mc and moped) Busses '00 '05 '10 '15 '20'22 Danish Energy Agency Side 40
Energy consumption for freight transport by means of transport PJ 80 60 40 20 0 1990 Trucks Domestic sea transport Total aviation '95 '00 '05 '10 Vans, 2-6 tonnes Train '15 '20'22 Danish Energy Agency Side 41
Energy and electricity consumption in agriculture and industry Climate-adjusted PJ 200 150 100 50 0 1990 '95 '00 Total energy consumption Electricity consumption '05 '10 '15 '20'22 Danish Energy Agency Side 42
Energy consumption in agriculture and industry by energy product Climate-adjusted PJ 180 150 120 90 60 30 0 1990 '95 '00 '05 '10 Natural gas Renewable energy etc. District heating '15 '20'22 Oil Coal and coke Electricity Danish Energy Agency Side 43
Energy consumption by individual industry in the agriculture and industry sector PJ Climate-adjusted 180 150 120 90 60 30 0 1990 '95 '00 '05 '10 '15 '20'22 Construction Manufacturing Fishing Agriculture, forestry and horticulture Danish Energy Agency Side 44
Electricity consumptions share of total energy consumption Climate-adjusted 40% 30% 20% 10% 0% 1990 '95 Agriculture and industry, total Agriculture, forestry and horticulture Manufacturing '00 '05 '10 '15 '20'22 Danish Energy Agency Side 45
Energy and electricity consumption in manufacturing industry Climate-adjusted PJ 125 100 75 50 25 0 1990 '95 '00 '05 '10 '15 '20'22 Total energy consumption Electricity consumption Danish Energy Agency Side 46
Composition of energy consumption in manufacturing industries Climate-adjusted 100% 80% 60% 40% 20% 0% 1980 1990 2000 2010 2020 2021 2022 Oil Coal and coke Electricity Natural gas Renewable energy etc. District heating Danish Energy Agency Side 47
Energy intensities in agriculture and industry Climate-adjusted TJ per million DKK GVA (2010 prices, chained values) 1,4 3,5 1,2 3,0 1,0 2,5 0,8 2,0 0,6 1,5 0,4 1,0 0,2 0,5 0,0 0,0 1990 '95 '00 '05 '10 '15 '20'22 Agriculture and industry, total Manufacturing Construction Agriculture and horticulture (Right axis) Danish Energy Agency Side 48
Electricity intensities in agriculture and industry Climate-adjusted TJ per million DKK GVA (2010 prices, chained values) 0,6 0,5 0,4 0,3 0,2 0,1 0,0 1990 '95 '00 '05 '10 '15 '20'22 Agriculture and industry, total Agriculture and horticulture Manufacturing Construction Danish Energy Agency Side 49
Energy consumption per employee in manufacturing industry Climate-adjusted GJ per employee 400 350 300 250 200 150 100 50 0 1990 '95 '00 '05 '10 '15 '20'22 Total energy Electricity Danish Energy Agency Side 50