Exact P-Value for Randomized Experiments and Quiz/HW Feedback
In this Day 24 session of Stat 301, exact p-values for randomized experiments were calculated in Investigation 3.6 Questions (a) - (f). The completion of both Section 1 and Section 2 of this investigation is noted. Additionally, comments on a quiz or homework assignment were provided.
Download Presentation

Please find below an Image/Link to download the presentation.
The content on the website is provided AS IS for your information and personal use only. It may not be sold, licensed, or shared on other websites without obtaining consent from the author. Download presentation by click this link. If you encounter any issues during the download, it is possible that the publisher has removed the file from their server.
E N D
Presentation Transcript
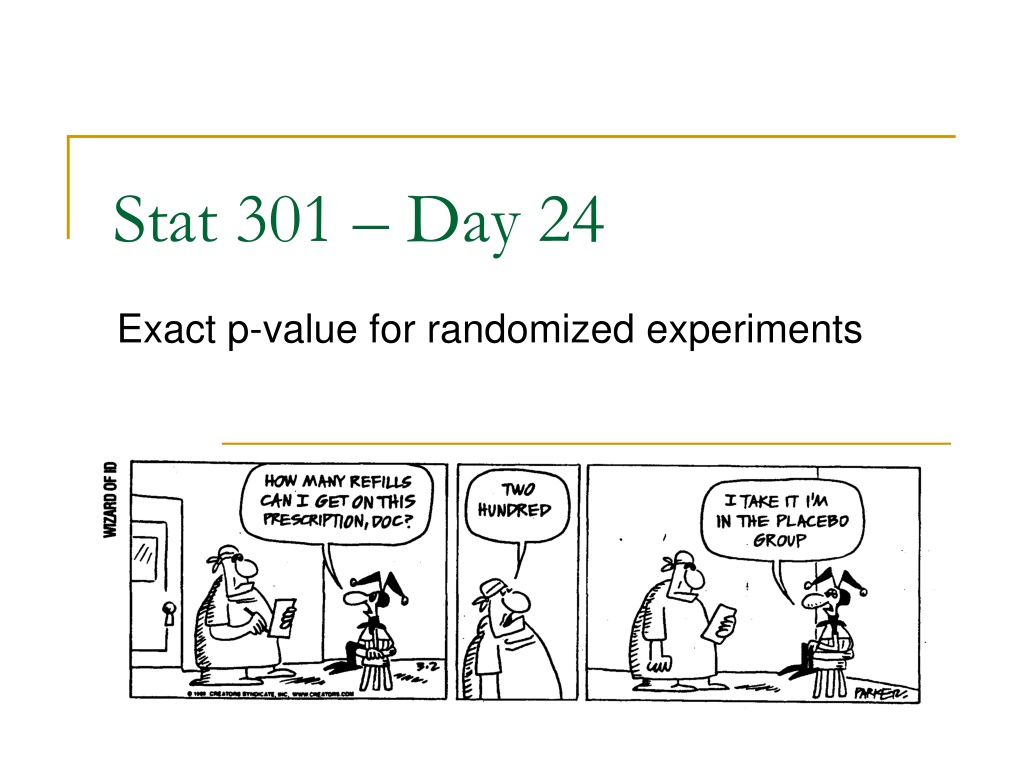
Stat 301 Day 24 Exact p-value for randomized experiments
Section 1 You ve completed Questions (a)-(f) of Investigation 3.6 !
Section 2 You ve completed Questions (a)-(f) of Investigation 3.6 !
Quiz/HW comments Large sample size means we expect the distribution of sample means to be approximately normal Bootstrapping = alternative (simulation-based) method for learning about the sampling distribution of a statistic (shape?, standard deviation) t* > z* but approaches z* with larger sample size (n) Segmented bar graphs should always go to 100% and display the conditional proportions (of those who use social media vs. of respondents who use social media and have some knowledge ) ??????? ?????= difference in probability of some knowledge (vs. less knowledge) Estimate parameter = confidence interval How size of ?1 ?2 impacts p-value, confidence interval Simulation needs to reflect study design, assess observed stat. Investigation 3.4 study protocol
Last Time: Randomization Test In a randomized comparative experiment, can assess the strength of evidence against null hypothesis: no genuine difference in the treatment probability of success (?1 ?2= 0) by re-randomizing the observed successes and failures into the two groups, and seeing how often get a difference in proportions at least as extreme as observed
Last Time: Randomization applet Reshuffle 13 successes and 17 failures into groups of 15 and 15
Dolphin Therapy Control Not Not Improve Improve Improve Improve Improve Improve Improve Improve Improve Improve Not Not Not Not Not Improve Improve Improve Improve Improve Improve Improve Improve Improve Improve Not Not Not Not Not Not Not Not Not Not Improve Improve Improve Improve Improve Improve Improve Improve Improve Improve This gives a simulated statistic of 6/15 7/15 = 0.067 Shuffled Difference in Proportions 7
Last Time: Randomization applet Reshuffle 13 successes and 17 failures into groups of 15 and 15 Repeat many times Null distribution Where centered? What do we care about? p-value = probability random assignment alone (Ho true) would give ?1 ?2 0.467
Last Time: Randomization Test p-value measures how often the random assignment process creates a difference in the conditional proportions at least as extreme by chance alone (assuming the null hypothesis is true) Small p-value in a randomized experiment is convincing evidence of cause-and-effect relationship (in direction of alternative hypothesis)
Last Time Could use # successes in Group A as statistic .46666 or larger 10 or more successes Where centered?
Simulation-based p-value Inv 3.6: Is yawning contagious Parameter: Difference in the probability of yawning with and without a yawn seed 34/50 x 14 = 9.52 16/50 x 14 = 4.48
What about an exact p-value Mathematical model of the shuffling process Let X represent the number of yawners in the YawnSeed group p-value = P(X > 10) = number of ways to have 10 yawners and 24 non-yawners in GroupA number of ways to select 34 people for the Yawnseed group = C(14, 10) x C(36, 24) C(50, 34)
Fishers Exact Test Let X count the number of successes in a sample of n objects selected from a population of N objects consisting of M successes , ( ) ( x X P = = ) ( , ) C M x C N M n x ( , ) C N n Two-way table applet, JMP, R
Fishers Exact Test Once have the two-way table, are multiple equivalent ways to calculate the p-value. Identifying values of M, n, and N and writing out P(X ? ?) Include detail on how you carried out the calculation (which inputs, which technology) Interpretation of p-value: X% of random shuffles would have a difference in proportions at least as extreme (larger or smaller?) as XX assuming no treatment effect (null hypothesis is true)
To Do Office hour today 3-4pm Continue Week 7 module: Complete Investigation 3.7 questions (a)-(e), (i) and (j) Start HW 6
