Digital Photo Point Count System for Ground Cover Measurement
Learn how to utilize a digital photo point count system to measure ground cover accurately. This method involves taking digital photos, using PowerPoint to analyze them, identifying species and components, and calculating confidence intervals based on sample size. Through digital image analysis, this system provides efficient and reliable data for assessing ground cover. The effects of varying sample sizes on confidence intervals for both normal and binomial distributions are explained in detail.

Download Presentation

Please find below an Image/Link to download the presentation.
The content on the website is provided AS IS for your information and personal use only. It may not be sold, licensed, or shared on other websites without obtaining consent from the author. Download presentation by click this link. If you encounter any issues during the download, it is possible that the publisher has removed the file from their server.
E N D
Presentation Transcript
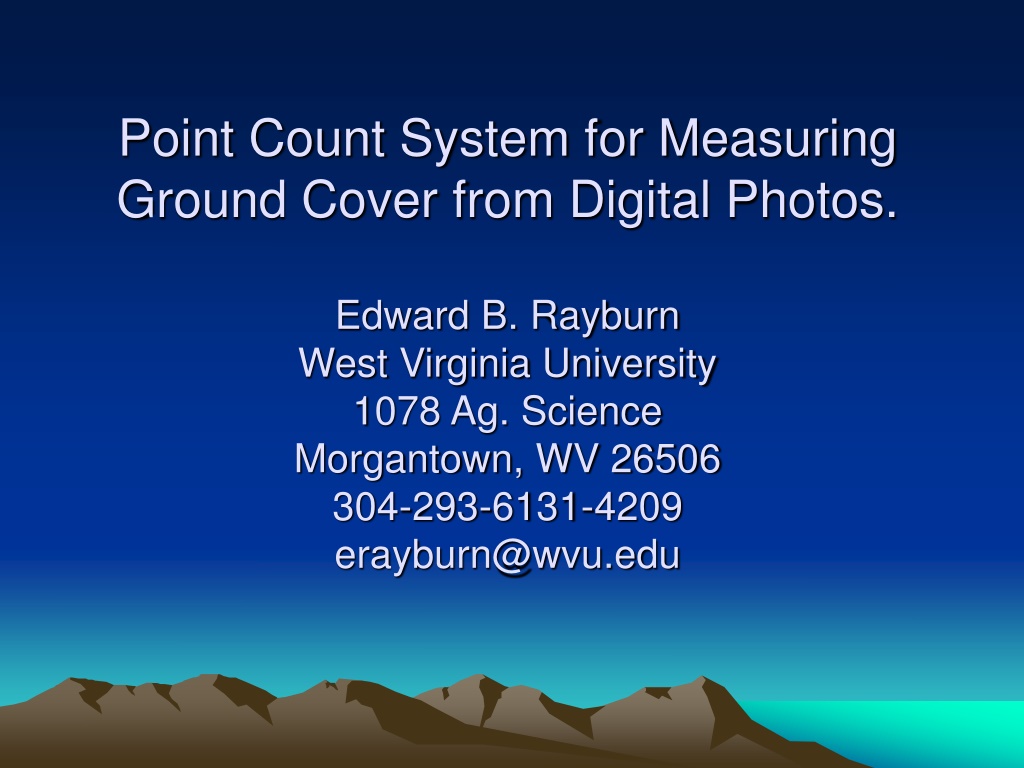
Point Count System for Measuring Ground Cover from Digital Photos. Edward B. Rayburn West Virginia University 1078 Ag. Science Morgantown, WV 26506 304-293-6131-4209 erayburn@wvu.edu
How to use the digital photo point count system. Take digital photos of the pasture or hay field. Import photos into PowerPoint as a picture. Copy the point count grid onto the slide. Identify the species, botanical component or bare ground at the tip of each V and tabulate the numbers. Relocate the grid and count again. For 100 points the CI is 13% (0.05 probability) at 50% frequency. For 250 points the CI is 8% (0.05 probability) at 50% frequency. More photos using 100 points/photo is probably better than taking more than 100 points on a photo. Clip some areas and hand separate the sample (quadrates in these photos) when calibrating percent ground cover against percent dry matter yield. The effect of sample size on the confidence interval of a mean for a normal distribution (as in measurement of yield) and a binomial distribution (as in measurement of percent) are presented below.
V V V V V V V V V V V V V V V V V V V V V V V V V V V V V V V V V V V V V V V V V V V V V V V V V V V V V V V V V V V V V V V V V V V V V V V V
V V V V V V V V V V V V V V V V V V V V V V V V V V V V V V V V V V V V V V V V V V V V V V V V V V V V V V V V V V V V V V V V V V V V V V V V
V V V V V V V V V V V V V V V V V V V V V V V V V V V V V V V V V V V V V V V V V V V V V V V V V V V V V V V V V V V V V V V V V V V V V V V V
Effect of Sample Size on the Confidence Interval - Binomial Distribution 1.0 0.8 Confidance Interval 10 points 0.6 50 points 0.4 100 points 0.2 0.0 0.0 0.2 0.4 0.6 0.8 1.0 Fraction of Observations
Effect of Sample Size on the Confidence Interval - Normal Distribution 0.4 Confidence Interval 0.3 SD = 0.15 0.2 = 0.30 0.1 0.0 0 10 Sample Size N 20 30