Enhanced Student Engagement through Strategic Campus Initiatives
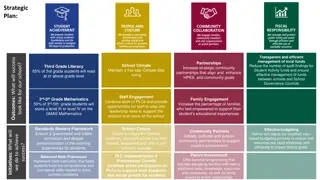
Student Affairs' three-year strategic plan focuses on consolidating campuses and enhancing the student experience through various programs and services. Leveraging new facilities, improving first-year student persistence, linking co-curricular activities to learning, fostering a supportive campus environment, ensuring student safety, and collaborating with enrollment management are key priorities. Measurements include satisfaction, program attendance, facility tracking, student learning assessments, and retention rates. Initiatives such as leveraging facilities, vibrant campus programs, and enhancing engagement through technology aim to create a dynamic and engaging campus community.
- - Student Affairs
- - Campus Consolidation
- - Student Experience
- - Strategic Plan
- - Engagement Initiatives

Download Presentation

Please find below an Image/Link to download the presentation.
The content on the website is provided AS IS for your information and personal use only. It may not be sold, licensed, or shared on other websites without obtaining consent from the author. Download presentation by click this link. If you encounter any issues during the download, it is possible that the publisher has removed the file from their server.
E N D
Presentation Transcript
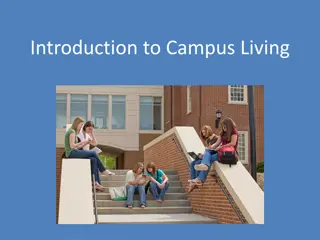
Student Affairs Three year strategic plan Background Consolidation of campuses Transforming the student experience
Three year strategic plan I. Leverage new facilities on the Pleasantville Campus II. Student Affairs programs and services will seek to improve first year student persistence III. Link co-curricular programming and services to learning experiences IV. Create and nurture a vibrant and supportive campus environment V. Create a safe environment with services that support the mental health and safety of our students. VI. Partner with Enrollment Management and University Relations to highlight campus life as a priority in recruitment efforts.
Student Affairs measurements Satisfaction, program attendance, facility tracking, use of space, involvement and swipe data, student learning assessment (rubrics, etc.), analytics, academic performance, co-curricular transcript, 1st to 2nd year retention, and graduation rate.
Leveraging our facilities 26 classes in Alumni FY16 Tracking using of FIG lounges & Study lounges Honors used the most FIR Joint effort to study writing Students presented at two conferences Writing Center Satellite Office Average 15 students participate each Suncay Collaboration with Honors College 4
Leveraging our facilities FIG Program FY students self-reported higher rates of interactions with peers than their counterparts at the University, as compared to the national average FY students self-report higher than the Upper-class and national averages that they would choose Pace again 5
Create a vibrant campus Program numbers FY 16 we had 9286 students attend 444 programs compared to FY 15 where we had 7480 students attend 489 programs. Of those programs 1403 students attended programs that were FIG focused and 2587 student attended SELF programs. (Upper- class programming model- Service, Experiential, Leadership and Foundations for the Future). Meaningful conversations 7
Increase engagement Measured through swipe technology Results for the last three years Goal this year and 3 week intervention 8
Swipe/Involvement Data Overall participation (F14, F15, F16) 472, 513, 480 # of events 309 events using card swipe # of unique attendees 1933 unique students (not filtered for just first year students!) First year Student (6 week data F14, F15, F16) 74%, 76%, 78% Housing 89%, 93%, 93% Commuter 42%, 37%, 46% Rate of Growth 2% overall growth last two years- Residents have remain the same, 4% growth for commuters (addition of Commuter Assistants and Commuter Programming) 9
FY17 Intervention calls Results 3 week 230 students had not attended an event at the end of our 3 weeks, of which 78 were residential, 151 were commuters We had 20 callers call each student (about 9-11 students each), at least once, and follow up with an email Results 6 week 135 students had not recorded attending any events that we tracked, Pace Connect spoke to 48 of these students 162 students had attended at least 1 event that we tracked, Pace Connect spoke to 30 of these students Pace Connect was able to call all students at least twice, netting a total of 78 responses between the two surveys 10
Rate of Change (3 to 6 weeks) 26.9% change, our goal was 15% - this only relates to a growth rate to those that were engaged in 0 swiped events 10% moved from not engaged, to engaged in at least 1 activity in relation to the entire first year class (62 out of 615) 11
First Year Retention OPAIR s Housing Metric report Fall to Spring Spring 2014 94.3% Spring 2015 94.4% Fall to Fall Fall 2014 80% Fall 2015 81.1% 12
Round table!! How are you using metrics on your campus to assess engagement and retention? Why are you using those methods? What successes have you had in measuring engagement and retention? 14
What might be one idea or objective that you took from today that your campus will look to implement? 15


")