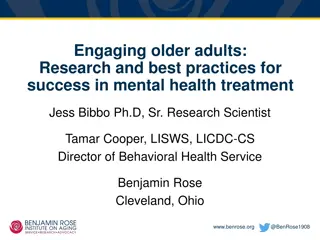
The Impact of Loneliness on Health and Mortality Among Aging Populations

Loneliness in older adults is a significant concern that can have detrimental effects on health and mortality rates. Research shows that social relationships play a crucial role in shaping health outcomes, with loneliness being comparable to well-known risk factors like smoking and high blood pressure. Understanding the impact of loneliness on physiology and mortality can help in developing interventions to address this issue.

Download Presentation

Please find below an Image/Link to download the presentation.
The content on the website is provided AS IS for your information and personal use only. It may not be sold, licensed, or shared on other websites without obtaining consent from the author. Download presentation by click this link. If you encounter any issues during the download, it is possible that the publisher has removed the file from their server.
E N D
Presentation Transcript
Figure 1: Percentage of Population aged 65+ 45 40 35 30 Percentage of Population (%) China 25 Japan Malaysia 20 R. of Korea Singapore 15 Source: Population Division of the Department of Economic and Social Affairs of the United Nation Secretariat, World Population Prospects: The 2010 Revision, http://esa.un.org/unpd/wpp/index.htm 10 5 0 1950 1960 1970 1980 1990 2000 2010 2020 2030 2040 2050
Figure 2:Percentage of Population aged 80+ 18 16 14 12 Percentage of Population (%) China 10 Japan Malaysia 8 R. of Korea Singapore 6 Source: Population Division of the Department of Economic and Social Affairs of the United Nation Secretariat, World Population Prospects: The 2010 Revision, http://esa.un.org/unpd/wpp/index.htm 4 2 0 1950 1960 1970 1980 1990 2000 2010 2020 2030 2040 2050
Loneliness and Mortality: Results from a Longitudinal Survey of Social Isolation, Health, and Lifestyles Angelique Chan, Prassana Rahman, Stefan Ma, and Rahul Malhotra Duke-NUS Graduate Medical School, Singapore
Trends in living arrangements in Singapore, South Korea, and Japan 1-person 2-person 3 or more Household Types in Asia 100% 90% 80% 70% 60% 50% 40% 30% 20% 10% 0% Singapore (2000) Singapore (2010) South Korea (2005) South Korea (2010) Japan (2000) Japan (2000) Source: UN Demographic Yearbook
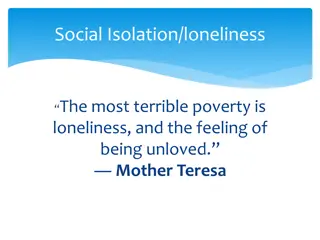
Why is loneliness important? Social relationships, or the relative lack thereof, constitute a major risk factor for health - rivaling the effect of well-established health risk factors such as cigarette smoking, blood pressure, blood lipids, obesity, and physical activity. (House, Landis, and Umberson; Science, 1988)
How does loneliness affect mortality? Pathways Main effects model: Social relationships directly encourage protective health behavior, and loneliness can alter human physiology (increased vascular resistance, higher systolic blood pressure) Mortality Loneliness Buffering model. Social relationships help dampen responses to stressors.
Category (n=4536) Never Lonely 49% Sometimes Lonely 32% Mostly Lonely 19%
60 50 40 30 20 10 0 Never Lonely Sometimes Lonely Mostly Lonely Alone With spouse only With children only With spouse and children With others only or maid only
Results Covariates / Model Model 1 Model 2 Model 3 Model 4 Loneliness (95% CI) Lubben Scale (95% CI) Living arrangements (95% CI) Alone Living with spouse Living with child Spouse and child Others only 1.10 * (1.05-1.15) - 1.10 * (1.05-1.15) 0.99 * (0.98-1.00) - 1.10 * (1.06-1.16) 0.99 * (0.98-1.00) 1.07 * (1.02-1.12) 0.99 (0.98-1.00) - 0.44 * (0.22-0.85) 0.88 (0.62-1.25) 0.63 * (0.43-0.92) Ref. 0.93 (0.54-1.60) 0.63 (0.31-1.29) 0.86 (0.61-1.22) 0.94 (0.63-1.39) Ref. 1.32 (0.77-2.25) * for p<0.05
Insight Perceived loneliness is associated with a greater risk of death in Singapore It is more predictive of mortality than living arrangements and social networks
How can we apply what we learned to policy? Multi-generational housing may be valuable, but it is not sufficient Policy should address perceived loneliness Psychosocial services Promote awareness by community and health care providers
Gender At age 60 women spend 70% of their life healthy versus 88% for men Education TLE and HLE ~ both are higher among those with high education Ethnicity is HLE ~ Higher among the Chinese
Gender is associated with TLE, IALE ~ both are higher among Women ALE ~ it is higher among men Education is associated with TLE and ALE ~ both are higher among those with high education Higher educated have higher TLE due to higher ALE. Ethnicity is associated with ALE ~ Higher among the Chinese
Policies to encourage employment among older persons = Positive outcomes
Loneliness 2 1.8 1.6 1.4 1.2 1 0.8 0.6 0.4 0.2 0 Time 1 Time2 still working at Time 2 not working (retired) at Time 2
Policies to encourage intergenerational relationships - Necessary
100% 90% 21 32 80% 41 7 70% 5 60% 4 50% 48 44 40% 41 30% 20% 24 10% 18 14 0% Men Women Total Neither receiving nor providing Only receiving Only providing Receiving and providing Source: PHASE 2011, elderly 62+ 33
100% 7 8 9 3 3 90% 3 80% 29 32 34 70% 60% 50% 40% 30% 59 57 56 20% 10% 0% Men Women Total Neither receiving nor providing Only receiving Only providing Receiving and providing Source: PHASE 2011, elderly 62+ Notes: Material support includes food, clothes, and other material goods 34
100% 4 10 16 90% 18 18 80% 18 70% 21 21 60% 21 50% 40% 30% 57 51 45 20% 10% 0% Men Women Total Neither receiving nor providing Only receiving Only providing Receiving and providing Source: PHASE 2011, elderly 62+ Notes: Time support includes providing help for childcare and housework; receiving help for housework, ADL-related care, IADL related care 35
100% 18 19 90% 20 80% 7 5 4 9 9 70% 9 60% 50% 40% 67 66 66 30% 20% 10% 0% Men Women Total Neither receiving nor providing Only receiving Only providing Receiving and providing Source: PHASE 2011, elderly 62+ 36