Analysis of Flood Loss and Damage in White Sulphur Springs and Rainelle
This data analysis focuses on the physical and human flood loss in White Sulphur Springs and Rainelle, West Virginia. It includes information on building damage estimates, displaced population figures, building loss ratios, and structural damage details from past flood events. The analysis sheds light on the impact of floods on these communities, highlighting areas of vulnerability and resilience.

Download Presentation

Please find below an Image/Link to download the presentation.
The content on the website is provided AS IS for your information and personal use only. It may not be sold, licensed, or shared on other websites without obtaining consent from the author. Download presentation by click this link. If you encounter any issues during the download, it is possible that the publisher has removed the file from their server.
E N D
Presentation Transcript
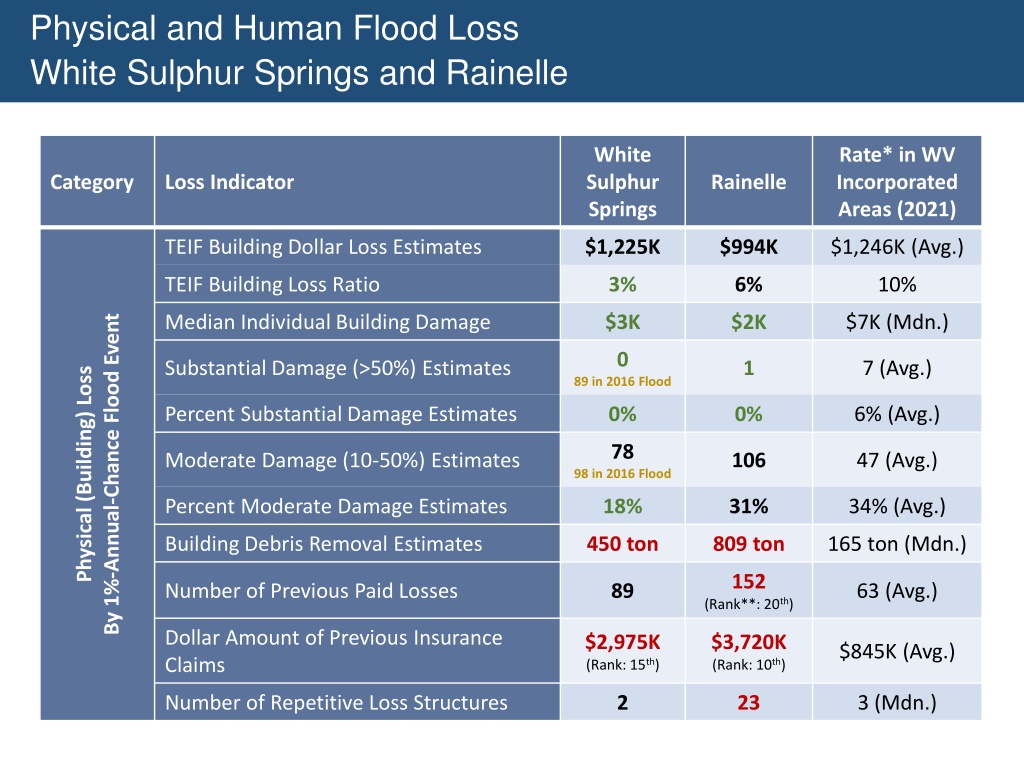
Physical and Human Flood Loss White Sulphur Springs and Rainelle White Sulphur Springs Rate* in WV Incorporated Areas (2021) Category Loss Indicator Rainelle TEIF Building Dollar Loss Estimates $1,225K $994K $1,246K (Avg.) TEIF Building Loss Ratio 3% 6% 10% Median Individual Building Damage $3K $2K $7K (Mdn.) By 1%-Annual-Chance Flood Event 0 Substantial Damage (>50%) Estimates 1 7 (Avg.) Physical (Building) Loss 89 in 2016 Flood Percent Substantial Damage Estimates 0% 0% 6% (Avg.) 78 Moderate Damage (10-50%) Estimates 106 47 (Avg.) 98 in 2016 Flood Percent Moderate Damage Estimates 18% 31% 34% (Avg.) Building Debris Removal Estimates 450 ton 809 ton 165 ton (Mdn.) 152 Number of Previous Paid Losses 89 63 (Avg.) (Rank**: 20th) Dollar Amount of Previous Insurance Claims $2,975K (Rank: 15th) $3,720K (Rank: 10th) $845K (Avg.) Number of Repetitive Loss Structures 2 23 3 (Mdn.)
Physical and Human Flood Loss White Sulphur Springs and Rainelle White Sulphur Springs Rate* in WV Incorporated Areas (2021) Category Loss Indicator Rainelle By 1%-Annual-Chance Flood Event 462 487 Displaced Population Estimates 173 (Avg.) (Rank: 17th) (Rank: 16th) Percent of Community Population Displaced 17% 36% 13% Human Loss Estimated Population in Need of Short- Term Shelter 104 123 37 (Avg.) (Rank: 18th) (Rank: 14th) Percent of Displaced Population in Need of Short-Term Shelter 23% 25% 24% * For numbers and dollar values, used median, or average where the median was zero or too low, in the state s 213 incorporated areas ** Ranks mentioned based on the BLRA data of April 2022 where the community is among the top 20 incorporated areas in WV The red texts show large difference, to the risk side, from the state ratios. The green texts show large difference, to the resilience side, from the state ratios.
Substantial Damage (2016 Flood) White Sulphur Springs
Building Damage Loss Estimates Rainelle
Structures with High Building Loss White Sulphur Springs Highest Building Loss (USD) in White Sulphur Springs: Building ID: 13-17-0008-0186-0000_703 Hazard Occupancy Class: COM8 (Restaurant) FIRM Status: Pre-FIRM (1968) Water Depth in Structure: 1.2 ft (minus rated -1 ft) Appraised Value: $1,422,200 Estimated Building Loss: $133,687 Building Damage Percentage: 10% Flood Tool Link Highest Building Damage Percentage in White Sulphur Springs: Building ID: 13-17-0008-0435-0000_382 Hazard Occupancy Class: RES1 (Residential 1 Family) FIRM Status: Post-FIRM (1988) Water Depth in Structure: 3.9 ft (minus rated -4 ft) Appraised Value: $62,200 Estimated Building Loss: $28,799 Building Damage Percentage: 46% Flood Tool Link
Structures with High Building Loss Rainelle Highest Building Loss (USD) in Rainelle: Building ID: 13-13-0001-0077-0000_144 Hazard Occupancy Class: RES1 (Residential 1 Family) FIRM Status: Post-FIRM regulated to Pre-FIRM (2005) Water Depth in Structure: 3.7 ft (minus rated -4 ft) Appraised Value: $92,800 Estimated Building Loss: $41,667 Building Damage Percentage: 45% Flood Tool Link Highest Building Damage Percentage in Rainelle: Building ID: 13-13-0001-0091-0000_435 Hazard Occupancy Class: RES2 (Mobile Home) FIRM Status: Pre-FIRM (1973) Water Depth in Structure: 2.7 ft (minus rated -3 ft) Appraised Value: $11,600 Estimated Building Loss: $8,120 Building Damage Percentage: 70% Flood Tool Link
Criteria, Rationale, and Data Sources Loss Indicator Criteria Rationale Data Source TEIF Building Dollar Loss Estimates Using FEMA s open-source Hazus utility, Flood Assessment Structure Tool (FAST) for a 1%- annual-chance flood event to calculate the damage percentages of the total building values (Total Exposure in Floodplain or TEIF) BLRA of 5/9/2023(based on 2022 tax assessment), Total Exposure in Floodplain (TEIF), Building percent damage estimate values, Depth grids TEIF Building Loss Ratio Median Individual Building Damage The median estimated individual building loss in each community Flood loss models quantify the degree of flood risk, including estimates of substantially damaged structures. Quantifying the degree of flood risk is important for risk communications and flood reduction efforts. BLRA of 5/9/2023(based on 2022 tax assessment), Total Exposure in Floodplain (TEIF), Building percent damage estimate values, Depth grids Substantial Damage (>50%) Estimates Number/percent of primary structures with the estimated damages of greater than 50% of the building value Percent Substantial Damage Estimates Moderate Damage (10-50%) Estimates BLRA of 5/9/2023(based on 2022 tax assessment), Total Exposure in Floodplain (TEIF), Building percent damage estimate values, Depth grids Number/percent of primary structures with the estimated damages of 10% to 50% of the building value Percent Moderate Damage Estimates The total tonnage of building debris that will be generated from a riverine 1%-annual- chance flood event based on FEMA s Hazus Flood Model. The model calculates only debris from the structure and not other types of debris (e.g., woody debris, sediment, content of buildings, etc.). Debris disposal can be a significant issue following floods. Debris removal estimates should be incorporated into debris removal plans. BLRA of 5/9/2023(based on 2022 tax assessment), Total Exposure in Floodplain (TEIF) Building Debris Removal Estimates A high number of claims in a community indicates that flooding is occurring, and community members are making claims against their policies. Number of paid losses in the community s history up to 2019 FEMA s Community Information System (CIS) 2019 Number of Previous Paid Losses
Criteria, Rationale, and Data Sources Loss Indicator Criteria Rationale Data Source A high total dollar amount of previous claims in a community indicates that flooding is occurring, and community members are making claims against their policies. Dollar Amount of Previous Insurance Claims Dollar amount of paid losses in the community s history up to 2019 FEMA's Community Information System (CIS) 2019 Number of structures (covered by NFIP Policies) that have experienced two or more losses of at least $1,000 each in a ten-year period. A preponderance of repetitive loss structures indicates that the community is at a higher risk for future losses. Number of Repetitive Loss Structures FEMA's Community Information System (CIS) 2019 The short-term displacement may happen by inundation causing damages to the residential units or blocking access to them. The evacuees plan to return to their communities after the inundation ends and the damaged residential units are restored. Until then, they may stay with their relatives or friends in safer areas, go to hotels, or use short-term shelters. The flood depth of evacuation is considered one foot that is the inundation at which vehicles begin to float. Estimated Displaced Population (by inundation >= 1 foot) for a 1%-Annual-Chance Flood Displaced Population Estimates BLRA of 5/9/2023(based on 2017 tax assessment), Census 2017 ACS Percent of Community Population Displaced Percent of the estimated displaced population in total community population Estimated Population in Need of Short-Term (up to two weeks) shelters computed using Hazus methodology with modifications of Age and Income (adjusted for inflation) factors. A Short-Term Shelter is in an existing facility, such as a school, community center, convention center, or church temporarily converted to provide safe, accessible, and secure short-term housing for disaster survivors. It provides safe and accessible locations with a wide range of services for the survivors for up to two weeks. Estimated Population in Need of Short-Term Shelter BLRA of 5/9/2023(based on 2017 tax assessment), Census 2017 ACS Percent of the individuals in need of short- term shelter in the estimated displaced population Percent of Displaced Population in Need of Short-Term Shelter


")