Understanding Demographic Indicators for Gender Analysis Workshop
This workshop delves into the significance of demographic indicators for analyzing gender relations. Covering topics such as demography, gender, data sources, sex ratio, fertility rates, and more, participants will explore key aspects of population dynamics. Through interactive sessions, attendees will gain insights into measures like fertility rates, life expectancy, and migration patterns to better understand gender disparities.
Download Presentation

Please find below an Image/Link to download the presentation.
The content on the website is provided AS IS for your information and personal use only. It may not be sold, licensed, or shared on other websites without obtaining consent from the author. Download presentation by click this link. If you encounter any issues during the download, it is possible that the publisher has removed the file from their server.
E N D
Presentation Transcript
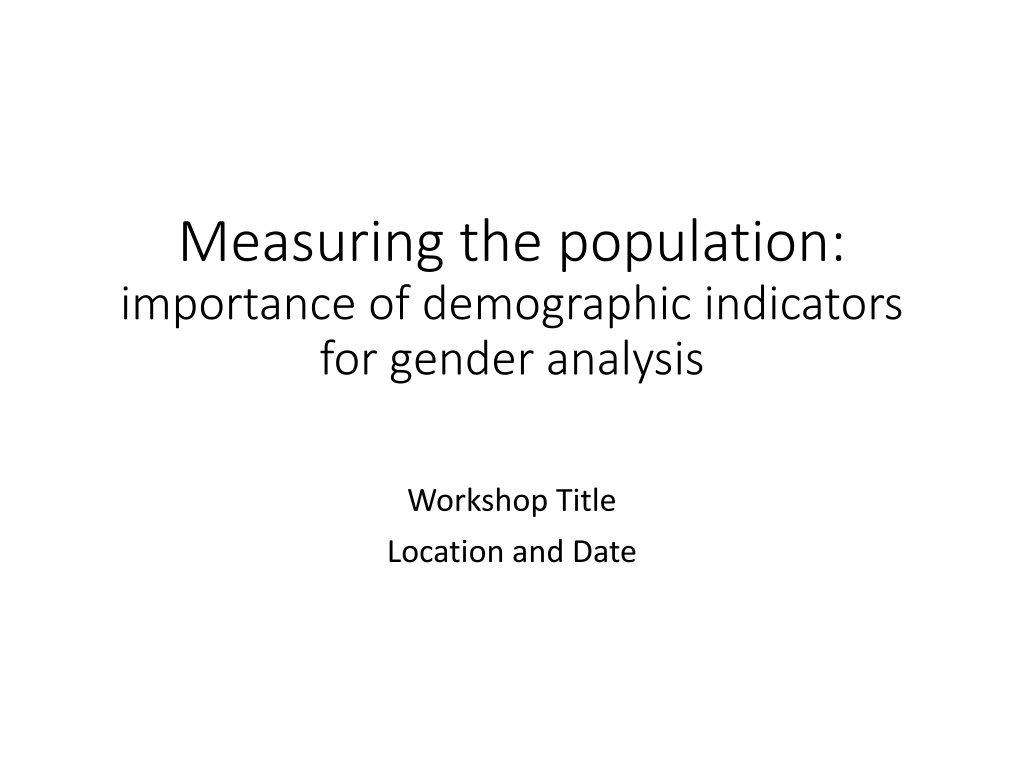
Measuring the population: importance of demographic indicators for gender analysis Workshop Title Location and Date
Session outline 1. What is demography? 2. Demography and gender 3. Data sources 4. Sex ratio at birth 5. Fertility rates 6. Group activity: comparing fertility and mortality
What is demography? A field of statistics that involves the study of human populations Structure and change (dynamics) of populations Births, deaths and migration Demographers produce indicators like: Fertility rates Life expectancy Migration rates Population growth estimates
Demography and gender Fundamental to monitoring gender relations How many women are there compared to men? Are many more boys born than girls? Size and composition of households Age at first marriage (early marriage?) and first child Number of children per woman Single-headed households Rural-urban migration by women and men
Main data sources Population and housing censuses Demographic and health surveys Civil registration systems (births, deaths, marriages) Population registers
What is the sex ratio? Guide: 100 = same number males as females Less than 100 = more females More than 100 = more males Female Male Sex ratio 95 92 99 91 93 98 93 86 European Union-28 Armenia Azerbaijan Georgia Kazakhstan Kyrgyzstan Moldova, Republic of Russian Federation Tajikistan Ukraine 259,339,081 1,573,567 4,679,645 2,349,394 8,691,313 2,837,242 1,847,483 76,936,816 3,909,796 24,443,259 247,291,379 1,450,560 4,616,138 2,141,304 8,100,112 2,770,269 1,712,035 66,264,905 3,987,516 20,969,728 102 86 Source: UNECE Statistical Database, compiled from national and international (Eurostat and UNICEF TransMONEE) official sources.
Sex ratios, Russian Federation, 2012 Sex ratio Females Males Sex ratio 86 Sex ratio of total population 76,936,816 66,264,905 Sex ratio at birth (2011) 872,825 923,804 106 Sex ratio for elderly (age 65+) 12,609,577 5,804,546 217 Source: UNECE Statistical Database, compiled from national and international (Eurostat and UNICEF TransMONEE) official sources.
Sex ratio at birth There are 104-106 boys born for every 100 girls Standard biological level Source: United Nations Population Fund. 2012. Sex Imbalances at Birth: Current trends, consequences and policy implications.
Son preference: identifying the problem Sex ratio at birth exceeds 110 Factors impacting prenatal sex selection: 1. Preference for sons 2. Availability of prenatal detection technology and abortion 3. Lower fertility rates
Source: United Nations Population Fund. 2012. Sex Imbalances at Birth: Current trends, consequences and policy implications.
Fertility rates Low, moderate and high fertility countries Consequences of fertility Structure of population Demand for services Economic production Burden of care in the home Environmental impacts
How to interpret the total fertility rate (TFR) Key factor influencing population growth/decline Replacement level fertility: TFR of 2.1 children per woman Total fertility rate Discussion Becoming the norm for many countries Armenia, Azerbaijan, Belarus, Georgia, Republic of Moldova, Russian Federation, Ukraine are all classified as low fertility countries Population ageing presents a challenge TFR of 2.0 or lower Low fertility TFR of 2.1 3.1 Moderate fertility Rates highest in Eastern, Middle and Western Africa In the EECCA region, Tajikistan is the only high fertility country TFR of 3.2 or higher High fertility
Global trends Fertility has declined significantly since 1994 High fertility a characteristic of least developed countries Low fertility is becoming more widespread Age pattern of childbearing a key factor Early marriage and adolescent fertility Decline in childbearing among older women Changes in government policies Low fertility: incentives to raise fertility; family friendly High fertility: education; family planning advice and contraception
Gender analysis: consequences Low fertility Aging population caring for the elderly Pressure to produce sons High fertility Health risks for mother and child Limits paid work opportunities; increases unpaid work Lower status of women
Group activity 1. Which country has the highest fertility rate in 2010? 2. Which has the highest infant mortality rate in 2010? 3. Which has the highest under five mortality rate in 2010? 4. Which country has achieved the fastest lowering of the under-five mortality rate between 1990 and 2013? 5. How has Armenia s fertility and child mortality rates changed over the last 110 years (1900-2010)?
Group activity 1. Which country has the highest fertility rate in 2010? Tajikistan with 3.78 children per woman Which has the highest infant mortality rate in 2010? Tajikistan with 52.1 deaths per 1,000 live births Which has the highest under five mortality rate in 2010? Turkmenistan with 61.0 deaths per 1,000 live births Which country has achieved the fastest lowering of the under- five mortality rate between 1990 and 2013? Tajikistan s rate has dropped by 60.5 and Azerbaijan s by 60.3 How has Armenia s fertility and child mortality rates changed over the last 110 years (1900-2010)? The TFR was the highest among these countries in 1900 (8.1) and it is now one of the lowest (1.6 in 2010 IMR is now one of the lowest in the region (14.7 in 2012)) 2. 3. 4. 5.
Discussion What impacts on fertility and child survival?


