Understanding ROC Curves and Operating Points in Model Evaluation
In this informative content, Geoff Hulten discusses the significance of ROC curves and operating points in model evaluation. It emphasizes the importance of choosing the right model based on the costs of mistakes like in disease screening and spam filtering. The content explains how logistical regression produces probability estimates that can be converted into classifications using thresholds. By adjusting the threshold, you can influence the false positive rate and false negative rate. It also touches on the concept of operating points and the implications of varying thresholds on model performance. The visual aids provided help in better understanding how changing thresholds impact classification results. The importance of tuning model parameters and evaluating on holdout data for threshold setting is highlighted.
Download Presentation

Please find below an Image/Link to download the presentation.
The content on the website is provided AS IS for your information and personal use only. It may not be sold, licensed, or shared on other websites without obtaining consent from the author. Download presentation by click this link. If you encounter any issues during the download, it is possible that the publisher has removed the file from their server.
E N D
Presentation Transcript
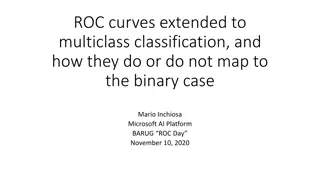
ROC Curves and Operating Points Geoff Hulten
Which Model should you use? Mistakes have different costs: Disease Screening LOW FN Rate Spam filtering LOW FP Rate False Positive Rate False Negative Rate Model 1 41% 3% Model 2 5% 25% Conservative vs Aggressive settings: The same application might need multiple tradeoffs Actually the same model - different thresholds
Classifications and Probability Estimates Logistic regression produces a score between 0 1 (probability estimate) 100% 90% 80% 70% Use threshold to produce classification 60% 50% 40% 30% What happens if you vary the threshold? 20% 10% 0% -6 -5 -4 -3 -2 -1 0 1 2 3 4 5 6
Example of Changing Thresholds Threshold = .5 False Positive Rate 33% Score Prediction Y False Negative Rate 0% .25 0 .45 0 Threshold = .6 False Positive Rate 33% .55 1 False Negative Rate 33% .67 0 Threshold = .7 .82 1 False Positive Rate 0% .95 1 False Negative Rate 33%
ROC Curve (Receiver Operating Characteristic) Percent of 0s classified as 1 Perfect score: 0% of 1s called 0 0% of 0s called 1 False Positive Rate 0% 10% 20% 30% 40% 50% 60% 70% 80% 90% 100% 0% 10% 20% 30% This model s distance from perfect False Negative Rate 40% Sweep threshold from 0 to 1 Threshold 0: all classified as 1 Threshold 1: all classified as 0 50% 60% 70% 80% Percent of 1s classified as 0 90% 100%
Operating Points Threshold .04 Threshold .05 Threshold .03 False Positive Rate 0% 10% 20% 30% 40% 50% 60% 70% 80% 90% 100% 0% 2) Target FN Rate 10% 20% 30% 3) Explicit cost: FP costs 10 FN costs 1 False Negative Rate 40% 50% 60% Threshold: 0.8 - 5FPs + 60FNs 110 cost 70% 80% Threshold: 0.83 - 4FPs + 65FNs 105 cost Interpolate between nearest measurements: - To achieve 30% FPR, use threshold of ~0.045 90% 100% Threshold: 0.87 - 3FPs + 90FNs 120 cost 1) Target FP Rate
Slight changes lead to drift: Today - threshold .9 -> 60% FNR Tomorrow - threshold .9 -> 62% FNR Might update thresholds more than model Pattern for using operating points # Train model and tune parameters on training and validation data # Evaluate model on extra holdout data, reserved for threshold setting ( xThreshold, yThreshold ) = ReservedData() # Find threshold that achieves operating point on this extra holdout data potentialThresholds = {} for t in range [ 1% - 100%]: potentialThresholds[t] = FindFPRate(model.Predict(xThreshold, t), yThreshold) bestThreshold = FindClosestThreshold(<targetFPRate>, potentialThresholds) # or interpolate # Evaluate on validation data with selected threshold to estimate generalization performance performanceAtOperatingPoint = FindFNRate(model.Predict(xValidate, bestThreshold), yValidate) # make sure nothing went crazy if FindFPRate(model.Predict(xValidate, bestThreshold), yValidate) <far from> potentialThresholds[bestThreshold]: # Problem?
Comparing Models with ROC Curves Model 1 better than Model 2 at every FPR or FNR target Area Under Curve (AUC) Integrate Area under the curve False Positive Rate 0% 10% 20% 30% 40% 50% 60% 70% 80% 90% 100% 0% Model 1 better than Model 2 at this FNR 10% Perfect score is 1 20% 30% False Negative Rate Higher scores allow for generally better tradeoffs 40% 50% 60% AUC of 0.5 indicates model is essentially randomly guessing 70% 80% Model 1: AUC ~97 Model 2: AUC ~89.5 90% AUC of < 0.5 indicates you re doing something wrong 100% Model 1 Model 2 Model 1 better than Model 2 at this FPR
More ROC Comparisons Model 1 better at low FNR ROC Curves Cross False Positive Rate 0% 10% 20% 30% 40% 50% 60% 70% 80% 90% 100% Model 2 better at low FPR 0% 10% Zoom in on region of interest 20% False Positive Rate 0% 1% 2% 3% 4% 5% 6% 7% 8% 9% 10% 30% 0% False Negative Rate 40% 5% Model 2: Worse AUC May be better at what you need 10% 50% 15% 60% False Negative Rate 20% 70% 25% Model 1: AUC ~97 Model 2: AUC ~93.5 80% 30% 90% 35% 100% 40% Model 1 Model 2 45% 50% Model 1 Model 2
Precision Recall Curves PR Curves Incremental Classifications More Accurate: Threshold continuing lower 95%+ of new 1s are actually 1s High Precision Threshold near 1: Everything classified as 1 is a 1 But many 1s are classified as 0 Incremental Classifications Less Accurate: Most new 1s are actually 0s 100% 90% Low Recall 80% 70% 60% Near perfect recall: All 1s classified as 1s Precision around 25% Precision 50% 40% Sliding threshold lower: Classify a bunch of 0s as 1s Structure indicative of a sparse, strong feature 30% 20% 10% 0% Threshold set to 0: Everything Classified as 1 0% 10% 20% 30% 40% 50% 60% 70% 80% 90% 100% Recall
ROC Curves & Operating Points Summary Vary the threshold used to turn score into classification to vary tradeoff between types of mistakes Operating points are the specific tradeoff your application needs Choose threshold to achieve target operating point using hold out data ROC curves allow: Visualization of all tradeoffs a model can make Comparison of models across types of tradeoffs Reset threshold as things change to avoid drift More data Different modeling New features New users Etc AUC an aggregate measure of quality across tradeoffs


