Analysis of Housing Affordability Issues in Geary, Pottawatomie, and Riley County Area
Professor Kirk McClure discusses housing affordability problems in the Geary, Pottawatomie, and Riley County area, highlighting the issue of households paying more than 30% of their income on housing. Data from Table 1 shows the percentage of owner-occupant households in different income brackets facing affordability challenges.

Download Presentation

Please find below an Image/Link to download the presentation.
The content on the website is provided AS IS for your information and personal use only. It may not be sold, licensed, or shared on other websites without obtaining consent from the author. Download presentation by click this link. If you encounter any issues during the download, it is possible that the publisher has removed the file from their server.
E N D
Presentation Transcript
Housing Affordability Problems Housing Affordability Problems in the in the Geary, Pottawatomie, and Riley Geary, Pottawatomie, and Riley County Area County Area Kirk McClure, Professor of Urban Planning mcclure@ku.edu
Housing Affordability Problem Housing Affordability Problem No single definition of affordability problems Generally accepted definition is paying more than 30% of income housing Usually restricted to low-income households Kirk McClure, Professor of Urban Planning mcclure@ku.edu
Table 1. Households Paying more than 30 percent of income on housing: Owner-Occupants All Owner-Occupier Households Owner-Occupier Households Income Less than $20,000 Owner-Occupant Households Income and Costs Known Owner-Occupant Households Paying More than 30% of Income Percent Owner-Occupant Households Income and Costs Known Owner-Occupant Households Paying More than 30% of Income Percent Three-County Area 22,872 4,325 18.9% 1,645 1,307 79.5% Geary County Pottawatomie County Riley County 4,974 6,645 11,253 1,304 1,146 1,875 26.2% 17.2% 16.7% 488 588 569 477 355 475 97.7% 60.4% 83.5% Kansas 739,835 130,134 17.6% 59,879 43,870 73.3% Kirk McClure, Professor of Urban Planning mcclure@ku.edu
Table 1. Households Paying more than 30 percent of income on housing: Owner-Occupants All Owner-Occupier Households Owner-Occupier Households Income Less than $20,000 Owner-Occupant Households Income and Costs Known Owner-Occupant Households Paying More than 30% of Income Percent Owner-Occupant Households Income and Costs Known Owner-Occupant Households Paying More than 30% of Income Percent Three-County Area 22,872 4,325 18.9% 1,645 1,307 79.5% Geary County Pottawatomie County Riley County 4,974 6,645 11,253 1,304 1,146 1,875 26.2% 17.2% 16.7% 488 588 569 477 355 475 97.7% 60.4% 83.5% Kansas 739,835 130,134 17.6% 59,879 43,870 73.3% Kirk McClure, Professor of Urban Planning mcclure@ku.edu
Table 1. Households Paying more than 30 percent of income on housing: Owner-Occupants All Owner-Occupier Households Owner-Occupier Households Income Less than $20,000 Owner-Occupant Households Income and Costs Known Owner-Occupant Households Paying More than 30% of Income Percent Owner-Occupant Households Income and Costs Known Owner-Occupant Households Paying More than 30% of Income Percent Three-County Area 22,872 4,325 18.9% 1,645 1,307 79.5% Geary County Pottawatomie County Riley County 4,974 6,645 11,253 1,304 1,146 1,875 26.2% 17.2% 16.7% 488 588 569 477 355 475 97.7% 60.4% 83.5% Kansas 739,835 130,134 17.6% 59,879 43,870 73.3% Kirk McClure, Professor of Urban Planning mcclure@ku.edu
Kirk McClure, Professor of Urban Planning mcclure@ku.edu
Kirk McClure, Professor of Urban Planning mcclure@ku.edu
Table 2. Households Paying more than 30 percent of income on housing: Renters All Renter households Renter Households Income Less than $20,000 Renter Households Income and Rent Known Renter Households Paying More than 30% of Income Percent Renter Households Income and Rent Known Renter Households Paying More than 30% of Income Percent Three-County Area 23,465 12,124 51.7% 5,441 5,091 93.6% Geary County Pottawatomie County Riley County 7,487 1,733 14,245 3,687 638 7,799 49.2% 36.8% 54.7% 1,206 346 3,889 1,159 315 3,617 96.1% 91.0% 93.0% Kansas 347,062 153,140 44.1% 91,524 80,155 87.6% Kirk McClure, Professor of Urban Planning mcclure@ku.edu
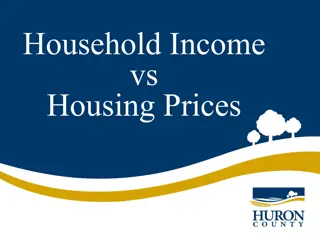
Housing Affordability Problem In a well functioning housing market, prices rise at the same rate as household income Kirk McClure, Professor of Urban Planning mcclure@ku.edu
Table 3. Housing Prices and Owner-Occupant Household Income Median Value Median Owner Income Percent Growth Percent Growth Ratio of Value to Income 2010 Year Year 2010 2017 2010 2017 2017 Geary County Pottawatomie County Riley County 118,600 138,600 154,800 141,900 169,300 189,200 19.6% 22.2% 22.2% 58,513 61,070 62,676 65,229 73,513 83,632 11.5% 20.4% 33.4% 2.0 2.3 2.5 2.2 2.3 2.3 Kansas 122,600 139,200 13.5% 61,690 70,126 13.7% 2.0 2.0 216.687 242.839 Consumer Price Index 12.1% Kirk McClure, Professor of Urban Planning mcclure@ku.edu
Table 3. Housing Prices and Owner-Occupant Household Income Median Value Median Owner Income Percent Growth Percent Growth Ratio of Value to Income 2010 Year Year 2010 2017 2010 2017 2017 Geary County Pottawatomie County Riley County 118,600 138,600 154,800 141,900 169,300 189,200 19.6% 22.2% 22.2% 58,513 61,070 62,676 65,229 73,513 83,632 11.5% 20.4% 33.4% 2.0 2.3 2.5 2.2 2.3 2.3 Kansas 122,600 139,200 13.5% 61,690 70,126 13.7% 2.0 2.0 216.687 242.839 Consumer Price Index 12.1% Kirk McClure, Professor of Urban Planning mcclure@ku.edu
Table 3. Housing Prices and Owner-Occupant Household Income Median Value Median Owner Income Percent Growth Percent Growth Ratio of Value to Income 2010 Year Year 2010 2017 2010 2017 2017 Geary County Pottawatomie County Riley County 118,600 138,600 154,800 141,900 169,300 189,200 19.6% 22.2% 22.2% 58,513 61,070 62,676 65,229 73,513 83,632 11.5% 20.4% 33.4% 2.0 2.3 2.5 2.2 2.3 2.3 Kansas 122,600 139,200 13.5% 61,690 70,126 13.7% 2.0 2.0 216.687 242.839 Consumer Price Index 12.1% Kirk McClure, Professor of Urban Planning mcclure@ku.edu
Table 3. Housing Prices and Owner-Occupant Household Income Median Value Median Owner Income Percent Growth Percent Growth Ratio of Value to Income 2010 Year Year 2010 2017 2010 2017 2017 Geary County Pottawatomie County Riley County 118,600 138,600 154,800 141,900 169,300 189,200 19.6% 22.2% 22.2% 58,513 61,070 62,676 65,229 73,513 83,632 11.5% 20.4% 33.4% 2.0 2.3 2.5 2.2 2.3 2.3 Kansas 122,600 139,200 13.5% 61,690 70,126 13.7% 2.0 2.0 216.687 242.839 Consumer Price Index 12.1% Kirk McClure, Professor of Urban Planning mcclure@ku.edu
Table 4. Rents and Renter-Occupant Household Income Median Gross Rent Median Renter Income Percent Growth Percent Growth Annual Rent as Percent of Income 2010 Year Year 2010 2017 2010 2017 2017 Geary County Pottawatome County Riley County 790 625 759 1,052 779 937 33.2% 24.6% 23.5% 35,915 32,605 26,247 41,171 38,077 34,631 14.6% 16.8% 31.9% 26% 23% 35% 31% 25% 32% Kansas 671 801 19.4% 29,029 34,059 17.3% 28% 28% 216.687 242.839 Consumer Price Index 12.1% Kirk McClure, Professor of Urban Planning mcclure@ku.edu
Housing Affordability Problem In a well functioning housing market, housing stock growth closely matches the rate of household formation Kirk McClure, Professor of Urban Planning mcclure@ku.edu
Table 5. Household Growth and Housing Stock Growth Households Housing Units Surplus Unit Growth Surplus as Percent of Stock Percent Growth Percent Growth Year Year 2010 2017 2010 2017 Three-County Area 43,981 48,119 9.4% 49,255 54,896 11.5% 1,503 3% Geary County Pottawatomie County Riley County 11,379 7,764 24,838 12,923 8,510 26,686 13.6% 9.6% 7.4% 13,586 8,412 27,257 15,301 9,297 30,298 12.6% 10.5% 11.2% 171 139 1% 1% 4% 1,193 Kansas 1,101,672 1,121,943 1.8% 1,222,749 1,259,647 3.0% 16,627 1% Kirk McClure, Professor of Urban Planning mcclure@ku.edu
Table 5. Household Growth and Housing Stock Growth Households Housing Units Surplus Unit Growth Surplus as Percent of Stock Percent Growth Percent Growth Year Year 2010 2017 2010 2017 Three-County Area 43,981 48,119 9.4% 49,255 54,896 11.5% 1,503 3% Geary County Pottawatomie County Riley County 11,379 7,764 24,838 12,923 8,510 26,686 13.6% 9.6% 7.4% 13,586 8,412 27,257 15,301 9,297 30,298 12.6% 10.5% 11.2% 171 139 1% 1% 4% 1,193 Kansas 1,101,672 1,121,943 1.8% 1,222,749 1,259,647 3.0% 16,627 1% Kirk McClure, Professor of Urban Planning mcclure@ku.edu
Table 5. Household Growth and Housing Stock Growth Households Housing Units Surplus Unit Growth Surplus as Percent of Stock Percent Growth Percent Growth Year Year 2010 2017 2010 2017 Three-County Area 43,981 48,119 9.4% 49,255 54,896 11.5% 1,503 3% Geary County Pottawatomie County Riley County 11,379 7,764 24,838 12,923 8,510 26,686 13.6% 9.6% 7.4% 13,586 8,412 27,257 15,301 9,297 30,298 12.6% 10.5% 11.2% 171 139 1% 1% 4% 1,193 Kansas 1,101,672 1,121,943 1.8% 1,222,749 1,259,647 3.0% 16,627 1% Kirk McClure, Professor of Urban Planning mcclure@ku.edu
Table 5. Household Growth and Housing Stock Growth Households Housing Units Surplus Unit Growth Surplus as Percent of Stock Percent Growth Percent Growth Year Year 2010 2017 2010 2017 Three-County Area 43,981 48,119 9.4% 49,255 54,896 11.5% 1,503 3% Geary County Pottawatomie County Riley County 11,379 7,764 24,838 12,923 8,510 26,686 13.6% 9.6% 7.4% 13,586 8,412 27,257 15,301 9,297 30,298 12.6% 10.5% 11.2% 171 139 1% 1% 4% 1,193 Kansas 1,101,672 1,121,943 1.8% 1,222,749 1,259,647 3.0% 16,627 1% Kirk McClure, Professor of Urban Planning mcclure@ku.edu
Table 5. Household Growth and Housing Stock Growth Households Housing Units Surplus Unit Growth Surplus as Percent of Stock Percent Growth Percent Growth Year Year 2010 2017 2010 2017 Three-County Area 43,981 48,119 9.4% 49,255 54,896 11.5% 1,503 3% Geary County Pottawatomie County Riley County 11,379 7,764 24,838 12,923 8,510 26,686 13.6% 9.6% 7.4% 13,586 8,412 27,257 15,301 9,297 30,298 12.6% 10.5% 11.2% 171 139 1% 1% 4% 1,193 Kansas 1,101,672 1,121,943 1.8% 1,222,749 1,259,647 3.0% 16,627 1% Kirk McClure, Professor of Urban Planning mcclure@ku.edu
Table 5. Household Growth and Housing Stock Growth Households Housing Units Surplus Unit Growth Surplus as Percent of Stock Percent Growth Percent Growth Year Year 2010 2017 2010 2017 Three-County Area 43,981 48,119 9.4% 49,255 54,896 11.5% 1,503 3% Geary County Pottawatomie County Riley County 11,379 7,764 24,838 12,923 8,510 26,686 13.6% 9.6% 7.4% 13,586 8,412 27,257 15,301 9,297 30,298 12.6% 10.5% 11.2% 171 139 1% 1% 4% 1,193 Kansas 1,101,672 1,121,943 1.8% 1,222,749 1,259,647 3.0% 16,627 1% Kirk McClure, Professor of Urban Planning mcclure@ku.edu
Table 5. Household Growth and Housing Stock Growth Households Housing Units Surplus Unit Growth Surplus as Percent of Stock Percent Growth Percent Growth Year Year 2010 2017 2010 2017 Three-County Area 43,981 48,119 9.4% 49,255 54,896 11.5% 1,503 3% Geary County Pottawatomie County Riley County 11,379 7,764 24,838 12,923 8,510 26,686 13.6% 9.6% 7.4% 13,586 8,412 27,257 15,301 9,297 30,298 12.6% 10.5% 11.2% 171 139 1% 1% 4% 1,193 Kansas 1,101,672 1,121,943 1.8% 1,222,749 1,259,647 3.0% 16,627 1% Kirk McClure, Professor of Urban Planning mcclure@ku.edu
Housing Affordability Problem In a well functioning housing market, the counts of units in each price range should closely match the number of households in the corresponding income category Kirk McClure, Professor of Urban Planning mcclure@ku.edu
Kirk McClure, Professor of Urban Planning mcclure@ku.edu
Riley County Kansas 2017 Renter Occupied Units by Rent of Unit and Income of Renter 6,000 Rent categories from $625 to $1250 are in surplus. 5,000 Number of Un its and Households 4,000 All rent categories below $500 have shortfalls. 3,000 2,000 1,000 Income Units 0 Inc: Less than $5,000 Rent: Less than $125 Inc: $5,000 to $9,999 Rent: $125 to $249 Inc: $10,000 to $14,999 Rent: $250 to $374 Inc: $15,000 to $19,999 Rent: $375 to $499 Inc: $20,000 to $24,999 Rent: $500 to $624 Inc: $25,000 to $34,999 Rent: $625 to $874 Inc: $35,000 to $49,999 Rent: $875 to $1249 Inc: $50,000 to $74,999 Rent: $1250 to $1874 Inc: $75,000 to $99,999 Rent: $1875 to $2499 Inc: $100,000 to $149,999 Rent: $2500 to $3749 Inc: $150,000 or more Rent: $3750 or more Renter Income Category and Unite Gross Rent Category Kirk McClure, Professor of Urban Planning mcclure@ku.edu
Housing Affordability in the Three Housing Affordability in the Three- -County Area County Area 1 in 6 owner-occupants and 1 in 2 renters suffer high housing cost hardship 70 to 90 of households with income below $20,000 CPI up 12%, incomes up faster at 14 to 18%, rents up 20% and values up 25% Stock growth (8%) slightly outpacing growth in households (5%) Individual submarkets, mostly in surplus among owners, shortage rentals < $500 The area has enough units, prices are generally good, but too many households have The area has enough units, prices are generally good, but too many households have insufficient income to enter the housing market without hardship insufficient income to enter the housing market without hardship Kirk McClure, Professor of Urban Planning mcclure@ku.edu
Thank you Thank you Kirk McClure, Professor of Urban Planning mcclure@ku.edu