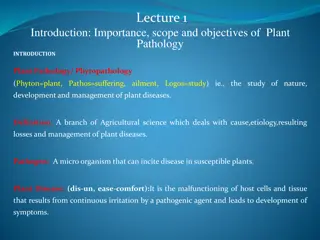
Understanding Temperature Measurement in Plant Growth

Exploring the measurement of maximum and minimum air temperature, its significance in analyzing trends and variations, and how temperature impacts plant growth stages. The optimal temperature ranges for different plant species and the importance of maximum and minimum temperature recordings using specialized thermometers are discussed. Additionally, the methods for measuring maximum and minimum temperatures, along with cardinal temperature limits for crops like Broccoli, Maize, Rice, Wheat, and others, are highlighted.

Download Presentation

Please find below an Image/Link to download the presentation.
The content on the website is provided AS IS for your information and personal use only. It may not be sold, licensed, or shared on other websites without obtaining consent from the author. Download presentation by click this link. If you encounter any issues during the download, it is possible that the publisher has removed the file from their server.
E N D
Presentation Transcript
Measurement of maximum and minimum air temperature its tabulation, trend and variation analysis.
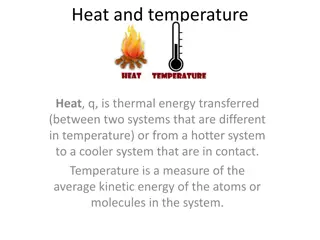
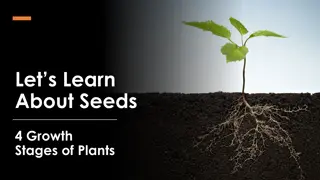
Rate of dependent upon the temperature surrounding the plant. Responses to temp. phenological stages. For most plant species, vegetative development usually has a higher optimum temperature than for reproductive development. Each plant species has a specific temperature range represented by a minimum, maximum, and optimum. Base or Cardinal Temperature plant growth and development is differ among crop
Minimum, maximum and optimum temperature limits for growth of Brocoli and Maize
Mini., Max., & optimum temp. For some crops Crop Rice Wheat Maize Oat Sorghum Pearl Millet Berseem Minimum 10 -12 3 -4.5 8 -10 4 - 5 8 -10 8 -10 3 - 4 Maxmum 36 - 38 30 -32 40 -44 29 - 31 42 -44 38 - 40 31 - 33 Optimum 30 -32 24-26 32 -35 24-26 33 -35 30 - 32 25 -27
Maximum and minimum temperature are recorded with maximum and minimum thermometers
Measurement of maximum temperature There is a constriction in the capillary of the glass tube below the lowest graduation of the scale. It is kept at an angle of less than 10o from the horizontal with the bulb downwards. The thermometer is mounted horizontally in the upper portion of the Stevenson screen. The reading of the maximum thermometer after setting should agree with that of dry bulb thermometer within 0.3oC. Reading taken at 07hr LMT
Measurement of minimum temperature Measuring fluid is alcohol, provided with a dump bell shaped index in the stem. As the temperature of the air falls, the meniscus retreats towards the bulb dragging with it the index, till the minimum temperature is reached. As the temperature rises, the index remains stationary. Thus the end of the index nearest from the bulb indicates the minimum temperature recorded since the thermometer was kept set. Record is taken during 14hrs LMT.
Stevenson screen Made of wood, Dimension (1/ X 1.5/ X 2/) and paint in white colour The floor of the screen is 4/ above the ground. Double roof having 2-3 inches air space. Side walls and door is made of wooden ventilator, allows only air but restricts solar radiation and precipitation. Door facing north side in the Northern Hemisphere so that only minimum sunlight would enter while the observer is reading the instruments
Four thermometers placed inside the Stevenson screen Maximum thermometer Minimum thermometer Dry bulb thermometer Wet bulb thermometer
The average of the maximum and the minimum temperature recorded during a day is called Mean temperature of the day. The difference between the maximum and the minimum temperature recorded during a day gives the diurnal range of temperature for the day.
Precautions for recording maximum and minimum temperature Take the temperature reading as quickly as possible After taking temperature corrections of the thermometers, obtained by calibration done with the standard thermometers earlier, should be applied. Avoid parallax error thermometers. After reading the thermometer, verify once again whether the whole number of degrees has been read correctly. Do not keep the door of the Stevenson screen open for a longer time than is necessary. readings, index while reading the
Use of temperature data to assess consumption of thermal energy a crop Growing degree days (GDD) is a weather-based indicator for assessing crop development. Growing degrees (GDs) is defined as the mean daily temperature (average of daily maximum and minimum temperatures) above a certain threshold base temperature accumulated on a daily basis over a period of time. Negative values are treated as zeros and ignored.
GDD can be calculated by using the following formula: GDD = ( GDD = (T Tmax max+ + T Tmin min) / 2 ) / 2 T Tbase base