Understanding Descriptive Statistics in Data Analysis
Descriptive statistics involve measuring and analyzing data to describe its features and characteristics. This includes means, medians, modes, maxima, minima, quartiles, quantiles, percentiles, variance, standard deviation, skewness, and kurtosis. These statistics provide insights into the spread, central tendency, and shape of the data distribution, helping in making informed decisions based on the data.

Uploaded on Sep 18, 2024 | 0 Views
Download Presentation

Please find below an Image/Link to download the presentation.
The content on the website is provided AS IS for your information and personal use only. It may not be sold, licensed, or shared on other websites without obtaining consent from the author. Download presentation by click this link. If you encounter any issues during the download, it is possible that the publisher has removed the file from their server.
E N D
Presentation Transcript
Introduction Types of Descriptive Statistics Means, medians, or modes Maxima and minima Quartiles, quantiles, and percentiles Variance, standard deviation, skewness, kurtosis The general principle for these type of descriptive statistics is that they should be based on at least N observations.
Means, medians, or modes Means The mean is the average of a series of values. This can present a disclosure issue if there are too few values in that series. For example: Average income in Team X = 33,350 Number of people in Team X = 2 If you are one of those 2 people, it is easy to work out what the income of the other person is. Medians Medians are the middle value if all values are ordered. This may be a single observation which could be a risk. Modes The most commonly appearing value. Even though it is most common value, the number of the observations with that value may fall below the threshold.
Maxima and minima The highest and lowest values in a series. These could be disclosive if the values correspond to too few observations. For example: Hospital Admissions Data for Doctors Practices in a CCG Practice Minimum Mean Median Maximum Dr A M Doyle s Practice 0 2 2 17 Dr M J Wilson s Practice 0 2 1 26 The Crescent Surgery 0 1 1 14 Waterloo Medical Centre 0 2 3 15
Quartiles, quantiles, and percentiles Quartiles, quantiles, and percentiles are used to show the distribution of the values of the series. This is done by dividing the series into four, equal parts, or 100 equal groups respectively. These values may refer to very few observations, and may be disclosive. For example: Table 1 - Quartile Salary Data at Company Y Minimum Q1 Q2 Q3 Maximum 17,300 21,200 26,700 43,895 72,180 Table 2 - Adjusted Quartile Salary Data at Company Y (rounded to nearest 1,000) Minimum Q1 Q2 Q3 Maximum 17,000 21,000 27,000 44,000 72,000
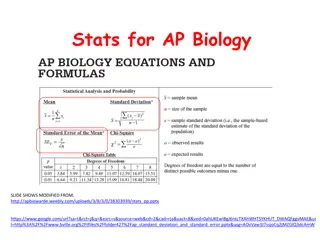
Variance, standard deviation, skewness, and kurtosis Variance, standard deviation, skewness, and kurtosis measure the shape of the distribution of a variable. Normally these are considered to be safe statistics. They must be based on a sufficient number of observations. However, if the number of observations is low, the context around the figures can be taken into account, and it might still be safe to release the statistics. In specific circumstances, if you have a scaled response variable (for example, observations that score an item between 1 and 10) and know the upper and lower bounds, the mean, and the variance it may be possible to recreate the underlying data. It is good practice to round these measures where possible to limit the potential risk to the data.
Assessments for this module SDAP: Safe Analyst Training Descriptive Statistics Created by Cancer Research UK, DKFZ, and The Health Foundation for the Safe Data Access Professionals Working Group