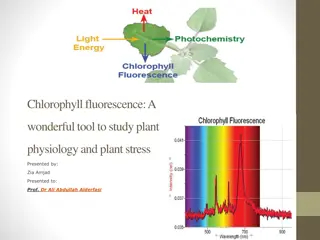
Insights into Seamount-Induced Chlorophyll Enhancements and Currents
Study explores the impact of seamounts on chlorophyll concentrations and fisheries catch, as well as the measurement of ocean currents using arrays of current meters. Additionally, the biophysical drivers influencing Seamount-Induced Chlorophyll Enhancements (SICE) are investigated using geophysical predictors like summit depth, Sea Surface Temperature (SST), and proximity to the equator.

Download Presentation

Please find below an Image/Link to download the presentation.
The content on the website is provided AS IS for your information and personal use only. It may not be sold, licensed, or shared on other websites without obtaining consent from the author. Download presentation by click this link. If you encounter any issues during the download, it is possible that the publisher has removed the file from their server.
E N D
Presentation Transcript
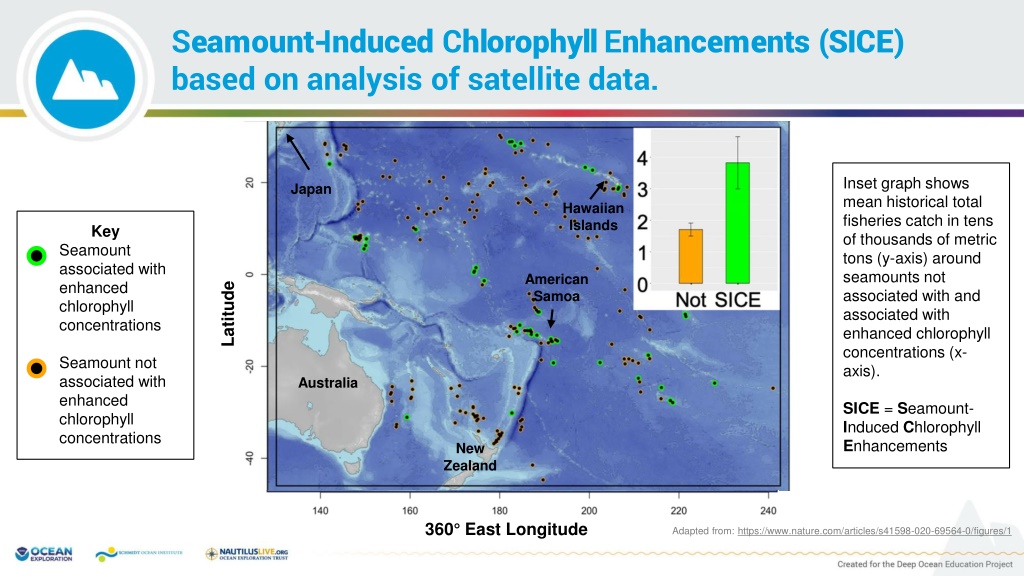
Seamount-Induced Chlorophyll Enhancements (SICE) based on analysis of satellite data. Inset graph shows mean historical total fisheries catch in tens of thousands of metric tons (y-axis) around seamounts not associated with and associated with enhanced chlorophyll concentrations (x- axis). Japan Hawaiian Islands Key Seamount associated with enhanced chlorophyll concentrations American Samoa Latitude Seamount not associated with enhanced chlorophyll concentrations Australia SICE = Seamount- Induced Chlorophyll Enhancements New Zealand 360 East Longitude Adapted from: https://www.nature.com/articles/s41598-020-69564-0/figures/1
Measuring Currents Current meters attached to cable anchored to bottom at one end and suspended by a buoy at other end taking measurements of currents. Several meters were located at various depths along each cable so water motion could be studied at intervals throughout water column. Each cable with its attached current meters is called an array. Each current meter is capable of recording water movement in 3 directions, similar to x, y, and z- axis of a 3D graph. Link: https://oceanservice.noaa.gov/podcast/july17/nop09-current-surveys.html
3-D Diagram of Mean Flows in Fieberling Guyot Circulation Cell Redrawn from Mullineaux and Mills, 1997
Biophysical Drivers of Seamount-Induced Chlorophyll Enhancements (SICE) A B C Figures A, B, and C show the plots of the modeled probability of SICE with three different geophysical predictors: (A) summit depth, (B) average Sea Surface Temperature (SST), and (C) degrees from equator, all significant predictors of SICE. Adapted from: https://www.nature.com/articles/s41598-020-69564-0/figures/2
")