Statistical Concepts Overview for Homework and Exam Preparation
Prepare for your test and homework assignments by reviewing key statistical concepts such as types of data, survey methods, data display techniques, measures of central tendency and variation, and correlation analysis. Stay organized with clear submission instructions and exam guidelines.

Download Presentation

Please find below an Image/Link to download the presentation.
The content on the website is provided AS IS for your information and personal use only. It may not be sold, licensed, or shared on other websites without obtaining consent from the author. Download presentation by click this link. If you encounter any issues during the download, it is possible that the publisher has removed the file from their server.
E N D
Presentation Transcript
Regarding the Homework: I will break the homework into two parts: questions from the book (80 pts) and a data activity (20 points). The first part (80 pts) is due Friday, but to allow you more flexibility, I will accept the data activity part (20 pts) Sunday by 12:00. You can turn the homework in in any fashion you like as long as it is easy to grade. Names on it Write clearly Make clear what is your final answer Submit questions in correct order
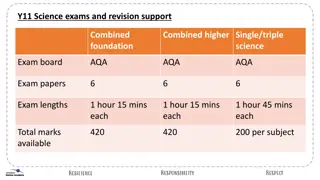
Exam Will begin around 10:00 (lecture from 9 to around 9:45) When you finish the exam, you can leave. Please be sure to use the restroom before the exam begins. Will be on paper. Simple/scientific calculator is allowed. No graphing calculators. Mostly multiple choice, a few fill in the blank. Maybe one or two short answer. On short answer, show your work for a shot at partial credit but please circle the final answer.
Chapter1 (not an exhaustive list) Basic definitions Types of data (quant, qual, nominal, ordinal, discrete, continuous, interval, ratio) Pros and cons of primary and secondary data Pros and cons of observational and experimental data Types of non-probability samples Types of probability samples Types of survey error
Chapter 2 (not exhaustive) Ways to display categorical data Summary and contingency table Ways to display numerical data Understand how to interpret these freq distribution Histogram Ordered array Stem and leave Pareto line Scatterplot/time series plot Bar chart
Chapter 3 (not exhaustive) Central tendency (3 measures of this) Variation (4 measures) How to interpret, how to calculate Shape (2 measures) How to interpret Z-scores How to calc, how to interp 5 number summary/box plot
Chap 3 (continued) Difference between mean and std dev in population and in the sample Empirical rule and Chebychev s Rule I will provide the formula for Chebychev s Rule Covariance How to calculate and how to interp Coef of Correlation How to calc and how to interp
Chap 4 (not exhaustive) Basic terms Joint probability How to calculate Conditional probability How to calculate Independence Bayes Theorem Be able to answer questions like what we did in class Counting Rules 1-3
I will provide: Chebychev s Rule Bayes Theorem Geometric Avg formula (if there is a question where it s necessary) What else? I will not provide: Variance/Std dev Covariance Coef of Correlation Counting rules 1-3


")
")
")
")
")