Effective Root Cause Analysis for Problem Solving
Explore the importance of Root Cause Analysis (RCA) in identifying, preventing, and treating underlying issues rather than just symptoms. Discover how brainstorming sessions and various RCA tools like 5 Whys and Fishbone Diagrams aid in problem-solving. Learn why RCA matters and how implementing it can drive positive change within organizations.
Download Presentation

Please find below an Image/Link to download the presentation.
The content on the website is provided AS IS for your information and personal use only. It may not be sold, licensed, or shared on other websites without obtaining consent from the author.If you encounter any issues during the download, it is possible that the publisher has removed the file from their server.
You are allowed to download the files provided on this website for personal or commercial use, subject to the condition that they are used lawfully. All files are the property of their respective owners.
The content on the website is provided AS IS for your information and personal use only. It may not be sold, licensed, or shared on other websites without obtaining consent from the author.
E N D
Presentation Transcript
Module 4 Root Cause Analysis
Root Cause Analysis Root cause analysis helps identify what, how and why something happened, thus preventing recurrence Root causes are underlying and reasonably identifiable The process involves data collection, cause charting and root cause identification
Root Cause Analysis Brainstorming sessions are highly useful Each individual s perspective is vital A good tool for high performance teams
Why Does RCA Matter? Determines actual cause of a problem rather than symptoms Allows us to treat problem rather than symptoms Allows us to put in place measures to keep problem from reoccurring
Change Management Iceberg Organizational Level 10% Culture Level 90%
Root Cause Analysis Tools
RCA Tools 5 Whys Fishbone Diagrams Affinity Diagrams
5 Whys Ask why until root cause can be determined Simple and effective If you don t ask the right questions, you don t get the right answers. A question asked in the right way often points to its own answer. Edward Hodnett
Yes! We could look into why we do not have a preventative maintenance program in place to prevent the swarf from building up. 5 Whys Does not have to stop after you ask why 5 times!
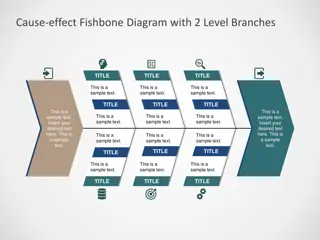
Fishbone Diagrams Simple and Effective Capture more potential factors Used in conjunction with 5 whys Help bring focus to brainstorming sessions
4 Ps Fishbone Diagram Plant People Policies Procedures
4Ps Fishbone Diagram Plant, People, Policies and Procedure Name Your Cause Here Name Your Cause Here Name Your Cause Here Name Your Cause Here Name Your Cause Here Name Your Cause Here Effect 4P s Name Your Cause Here Name Your Cause Here Name Your Cause Here Name Your Cause Here Name Your Cause Here Name Your Cause Here
4 Ss Fishbone Diagram Surroundings Suppliers Systems Skills
4Ss Fishbone Diagram Surroundings, Suppliers, Systems and Skills Name Your Cause Here Name Your Cause Here Name Your Cause Here Name Your Cause Here Name Your Cause Here Name Your Cause Here Effect 4P s Name Your Cause Here Name Your Cause Here Name Your Cause Here Name Your Cause Here Name Your Cause Here Name Your Cause Here
6 Ms Fishbone Diagrams Man Machine Management Measurement Material Method
6Ms Fishbone Diagram Man, Machine, Management, Measurement, Material and Method Name Your Cause Here Name Your Cause Here Name Your Cause Here Name Your Cause Here Name Your Cause Here Name Your Cause Here Name Your Cause Here Name Your Cause Here Name Your Cause Here Effect 6M s Name Your Cause Here Name Your Cause Here Name Your Cause Here Name Your Cause Here Name Your Cause Here Name Your Cause Here Name Your Cause Here Name Your Cause Here Name Your Cause Here
Affinity Diagrams Uses everyone s thoughts and ideas Allows for individual brainstorming followed by group collaboration Works well across multiple shifts People are not boxed in by predetermined categories
Affinity Diagrams Everyone writes their ideas down on post it notes Notes are placed randomly on a large wall or board Post it notes are then organized into categories or grouped into common causes (no talking allowed during this step) Group collaboration determines the most like cause/causes
When to use Affinity Diagrams? Across multiple shifts When group collaboration is a must When a problem is complex or hard to grasp Allows the group to move past preconceived ideas
 undefined


