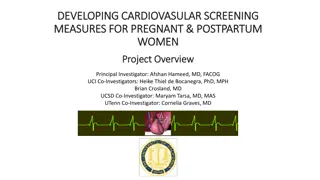
Association of Fruit, Vegetable, and Legume Intake with Cardiovascular Disease and Mortality
The study conducted by the PURE investigators examined the relationship between fruit, vegetable, and legume consumption and cardiovascular disease (CVD) and mortality in a cohort of 135,335 individuals from 18 countries. Dietary guidelines recommend at least 5 daily servings of these foods, which have been associated with a lower risk of CVD and mortality. The study aimed to assess the impact of these dietary habits on health outcomes such as major CVD events and total mortality over a median follow-up of 7.4 years.

Download Presentation

Please find below an Image/Link to download the presentation.
The content on the website is provided AS IS for your information and personal use only. It may not be sold, licensed, or shared on other websites without obtaining consent from the author. Download presentation by click this link. If you encounter any issues during the download, it is possible that the publisher has removed the file from their server.
E N D
Presentation Transcript
Fruit, vegetable and legume intake and CVD and deaths: the Prospective Urban Rural Epidemiology (PURE) study of 135,335 people in 18 countries Andrew Mente, on behalf of the PURE investigators
Duality of Interests None to declare with regards this presentation
Background Dietary guidelines recommend at least 5 daily servings ( 400 g) of fruits, vegetables and legumes Associated with lower risk of CVD and mortality, but could be influenced by health seeking behaviors - Few data from South America, Middle East, Africa and South Asia; Most data from N Amer, Europe, China, Japan Recommendations do not differentiate between raw and cooked vegetable intake
Aims To assess the association between fruit, vegetable and legume consumption and cardiovascular disease and mortality in 135,335 individuals in 18 countries
Study Methods Design: Prospective cohort study Population: Unbiased selection from general population in 667 urban/rural communities in 18 countries N=135,335; aged 35-70 years, without CVD at baseline Exposure: Country-specific, validated food frequency questionnaires Covariates: Demographics, other lifestyle, health history, center Outcomes: Major CVD (CV death and nonfatal MI, stroke, and heart failure) (n=4784), using standardized definitions; total mortality (n=5796) Follow-up: Median 7.4 years
PURE: 135,335 from 667 communities in 18 Phase 1 countries from 5 continents Target: 200,000 people
Countries Countries Geographic region N South Asia China Bangladesh, India, Pakistan China 29,560 42,152 Southeast Asia Malaysia 10,038 Africa South Africa, Zimbabwe 4,558 North America Middle East Canada, Poland, Sweden, Iran, Occupied Palestinian Territory, Turkey, United Arab Emirates 14,916 11,485 South America Argentina, Brazil, Chile, Colombia 22,626 Overall 135,335
Phase-1 participants included in these analyses N=157,543 participants from 18 countries Did not complete an FFQ (6.9%) N=146,646 completed FFQ Implausible values (1.9%) Energy <500 or >5000 kcal/d N=143,934 Missing follow-up (0.9%) N=142,704 Baseline CVD (5.2%) N=135,335
Statistical Methods Studied time to events Multivariable Cox frailty analysis with random intercepts to account for correlation of observation within centers Adjusted for: Age, sex, urban/rural location Education, smoking, physical activity, diabetes Energy intake, meats, bread & cereal When reporting fruit, adjust for vegetables, and vice-versa
Risk of mortality by total fruit, veg & legume intake Servings/day N <1 /day 1 to <2 /day 2 to <3 /day 3 to <4 /day 4 to <5 /day 5 to <6 /day 6 to <8 /day 7 to <8 /day >8 /day P for trend No. of deaths (%) 736 (8.1%) 1371 (7.2%) Age & sex adj. 1.0 (ref) 0.92 (0.84-1.01) 0.81 (0.74-0.89) 0.65 (0.58-0.74) 0.65 (0.58-0.74) 0.62 (0.53-0.71) 0.63 (0.54-0.75) 0.61 (0.50-0.74) 0.58 (0.50-0.74) <0.0001 Full adjusted 1.0 (ref) 1.01 (0.91-1.12) 0.91 (0.82-1.01) 0.78 (0.69-0.88) 0.83 (0.72-0.95) 0.78 (0.66-0.91) 0.84 (0.70-1.00) 0.83 (0.67-1.02) 0.81 (0.68-0.96) 0.0001 9082 19036 1529 (4.4%) 35128 772 (3.2%) 24485 468 (3.2%) 14849 286 (2.9%) 9790 198 (2.9%) 6945 131 (2.7%) 4857 305 (2.7%) 11163
Risk of mortality and major CVD by total fruit, vegetable and legume intake (servings/day) Mortality HR (95% CI) Major CVD Intake Intake HR (95% CI) 0.6 0.8 P-trend=0.0001 1.2 0.6 0.8 1 P-trend=0.13 1.2 1.4 1
Risk of mortality and major CVD by fruit intake (servings) Mortality HR (95% CI) Major CVD Intake Intake HR (95% CI) 0.8 P-trend=0.11 0.6 1 1.2 0.8 1 P-trend<0.0001 0.6 1.2
Risk of mortality and major CVD by vegetable intake (servings/day) Mortality HR (95% CI) Major CVD Intake Intake HR (95% CI) P-trend=0.38 1 1.2 1.4 P-trend=0.12 1.2 0.6 0.8 1 0.8
Mean raw and cooked vegetable intake by region Excluding China (N=42,152)
Intake HR (95% CI) HR (95% CI) Intake HR (95% CI) HR (95% CI) Risk of mortality and major CVD by raw vegetable intake (servings) Mortality HR (95% CI) Major CVD Mortality Major CVD Intake Intake HR (95% CI) <1/month 1.00 (1.00, 1.00) 1.00 (1.00, 1.00) <1/month 1.00 (1.00, 1.00) 1.00 (1.00, 1.00) 1/month to <1/week 0.86 (0.76, 0.98) 0.86 (0.76, 0.98) 1/month to <1/week 0.96 (0.82, 1.13) 0.96 (0.82, 1.13) 1/week to <3/week 0.78 (0.68, 0.89) 0.78 (0.68, 0.89) 1/week to <3/week 0.86 (0.73, 1.01) 0.86 (0.73, 1.01) >3/week 0.77 (0.66, 0.89) 0.77 (0.66, 0.89) >3/week 0.91 (0.77, 1.09) 0.91 (0.77, 1.09) P-trend=0.27 1.2 0.8 1.2 1 1 P-trend=0.0004 0.6 0.6 0.8 Excluding China .4 .6 .8 1 1 1.2 .6 .8 1 1 1.2 1.4
Risk of mortality and major CVD by cooked vegetable intake (servings) Mortality HR (95% CI) Major CVD Intake Intake HR (95% CI) 0.6 0.8 1 1.2 P-trend=0.011 0.8 1 1.2 P-trend=0.085 1.4 Excluding China
Risk of mortality and major CVD by legume intake (servings) Mortality HR (95% CI) Major CVD Intake Intake HR (95% CI) 1 1.2 1 0.6 0.6 0.8 P-trend=0.19 P-trend=0.0013 0.8 1.2
Conclusions Fruit, vegetables and legumes associated with a moderately lower risk of mortality, but not CVD Benefits appear to reach a maximum versus mortality at 3 to 4 daily servings (375 g) Raw vegetables appear to be more protective than cooked vegetables A balanced diet of >3-4 daily servings fruit, vegs. and legumes is associated with lower mortality
Total fruit, vegetable and legume intake vs. mortality 1.2 1.0 HR 0.8 0.6 9 6 7 8 Servings/day 4 5 0 1 3 2
Mean contribution of fruit type to total fruit intake 4 Mean daily intake (servings) 3 2 1 0 Overall 135,335 N Am/Eur 14,916 S Amer 22,626 Mid East 11,485 S Asia 29,560 China 42,152 SE Asia 10,038 Africa 4,558 Yellow/orange Red/purple Green Other
Mean contribution of vegetable type to total vegetable intake 4 Mean daily intake (servings) 3 2 1 0 Overall 93,183 N Am/Eur 14,916 S Amer 22,626 Mid East 11,485 S Asia 29,560 SE Asia 10,038 Africa 4,558 Cruciferous Dark Yellow Green Leafy Other Excluding China (N=42,152) because FFQ did not collect vegetable intake by type
Risk of MI and stroke by total fruit, vegetable and legume intake (servings/day) Myocardial Infarction Stroke Intake HR (95% CI) HR (95% CI) Intake HR (95% CI) HR (95% CI) MI <1/day 1 to <2/day 2 to <3/day 3 to <4/day 4 to <5/day 5 to <6/day 6 to <7/day 7 to <8/day >8/day Stroke <1/day 1 to <2/day 2 to <3/day 3 to <4/day 4 to <5/day 5 to <6/day 6 to <7/day 7 to <8/day >8/day N=9,082 N=19,032 N=35,128 N=24,485 N=14,849 N=9,790 N=6,945 N=4,857 1.00 (1.00, 1.00) 1.04 (0.85, 1.27) 1.15 (0.95, 1.40) 1.15 (0.93, 1.43) 1.28 (1.02, 1.61) 0.87 (0.66, 1.14) 0.84 (0.62, 1.13) 0.91 (0.65, 1.27) 1.00 (1.00, 1.00) 1.04 (0.85, 1.27) 1.15 (0.95, 1.40) 1.15 (0.93, 1.43) 1.28 (1.02, 1.61) 0.87 (0.66, 1.14) 0.84 (0.62, 1.13) 0.91 (0.65, 1.27) 0.99 (0.74, 1.31) 0.99 (0.74, 1.31) 1.00 (1.00, 1.00) 1.02 (0.82, 1.27) 1.05 (0.86, 1.29) 1.04 (0.84, 1.29) 1.16 (0.92, 1.47) 1.12 (0.85, 1.47) 1.11 (0.82, 1.50) 1.19 (0.84, 1.67) 1.00 (1.00, 1.00) 1.02 (0.82, 1.27) 1.05 (0.86, 1.29) 1.04 (0.84, 1.29) 1.16 (0.92, 1.47) 1.12 (0.85, 1.47) 1.11 (0.82, 1.50) 1.19 (0.84, 1.67) 0.92 (0.67, 1.25) 0.92 (0.67, 1.25) N=11,163 P-trend=0.71 P-trend=0.20 .8 .8 .6 1 1 1.2 1.8 .6 1 1 1.2 1.8
Risk of CV and non-CV mortality by total fruit, vegetable and legume intake (servings/day) CV mortality Non-CV mortality Intake HR (95% CI) HR (95% CI) Intake HR (95% CI) HR (95% CI) CV mortality <1/day 1 to <2/day 2 to <3/day 3 to <4/day 4 to <5/day 5 to <6/day 6 to <7/day 7 to <8/day >8/day Non-CV mortality <1/day 1 to <2/day 2 to <3/day 3 to <4/day 4 to <5/day 5 to <6/day 6 to <7/day 7 to <8/day >8/day N=9,082 N=19,032 N=35,128 N=24,485 N=14,849 N=9,790 N=6,945 N=4,857 1.00 (1.00, 1.00) 0.81 (0.71, 1.06) 0.90 (0.73, 1.10) 0.81 (0.65, 1.02) 0.91 (0.71, 1.17) 0.58 (0.42, 0.80) 0.80 (0.57, 1.10) 0.90 (0.62, 1.31) 1.00 (1.00, 1.00) 0.81 (0.71, 1.06) 0.90 (0.73, 1.10) 0.81 (0.65, 1.02) 0.91 (0.71, 1.17) 0.58 (0.42, 0.80) 0.80 (0.57, 1.10) 0.90 (0.62, 1.31) 0.73 (0.53, 1.02) 0.73 (0.53, 1.02) 1.00 (1.00, 1.00) 1.05 (0.93, 1.19) 0.91 (0.80, 1.03) 0.77 (0.66, 0.89) 0.80 (0.68, 0.95) 0.87 (0.71, 1.05) 0.87 (0.70, 1.09) 0.80 (0.62, 1.05) 1.00 (1.00, 1.00) 1.05 (0.93, 1.19) 0.91 (0.80, 1.03) 0.77 (0.66, 0.89) 0.80 (0.68, 0.95) 0.87 (0.71, 1.05) 0.87 (0.70, 1.09) 0.80 (0.62, 1.05) 0.84 (0.68, 1.04) 0.84 (0.68, 1.04) N=11,163 P-trend=0.057 P-trend=0.0038 .4 .6 .8 1 1 1.21.4 .6 .8 1 1 1.2
Risk of total mortality by tertiles of total fruit, vegetable and legume intake (servings/day), by region Intake HR (95% CI) HR (95% CI) South Asia T2 vs. T1 T3 vs. T1 0.84 (0.76, 0.93) 0.84 (0.76, 0.93) 0.68 (0.60, 0.78) 0.68 (0.60, 0.78) China T2 vs. T1 T3 vs. T1 0.95 (0.82, 1.09) 0.95 (0.82, 1.09) 0.83 (0.69, 0.98) 0.83 (0.69, 0.98) Southeast Asia T2 vs. T1 T3 vs. T1 1.35 (1.00, 1.82) 1.35 (1.00, 1.82) 1.24 (0.89, 1.73) 1.24 (0.89, 1.73) Africa T2 vs. T1 T3 vs. T1 1.30 (0.72, 2.35) 1.30 (0.72, 2.35) 1.42 (0.76, 2.65) 1.42 (0.76, 2.65) North Am/Eur T2 vs. T1 T3 vs. T1 1.10 (0.84, 1.44) 0.82 (0.59, 1.14) 0.82 (0.59, 1.14) 1.10 (0.84, 1.44) Middle East T2 vs. T1 T3 vs. T1 0.90 (0.63, 1.29) 0.78 (0.50, 1.18) 0.78 (0.50, 1.18) 0.90 (0.63, 1.29) South America T2 vs. T1 T3 vs. T1 0.92 (0.77, 1.09) 0.92 (0.77, 1.09) 0.84 (0.67, 1.04) 0.84 (0.67, 1.04) .4 .8 1 1 1.4 2 2.8
PURE: 195,000 from 1000 communities in 26 countries from 5 continents