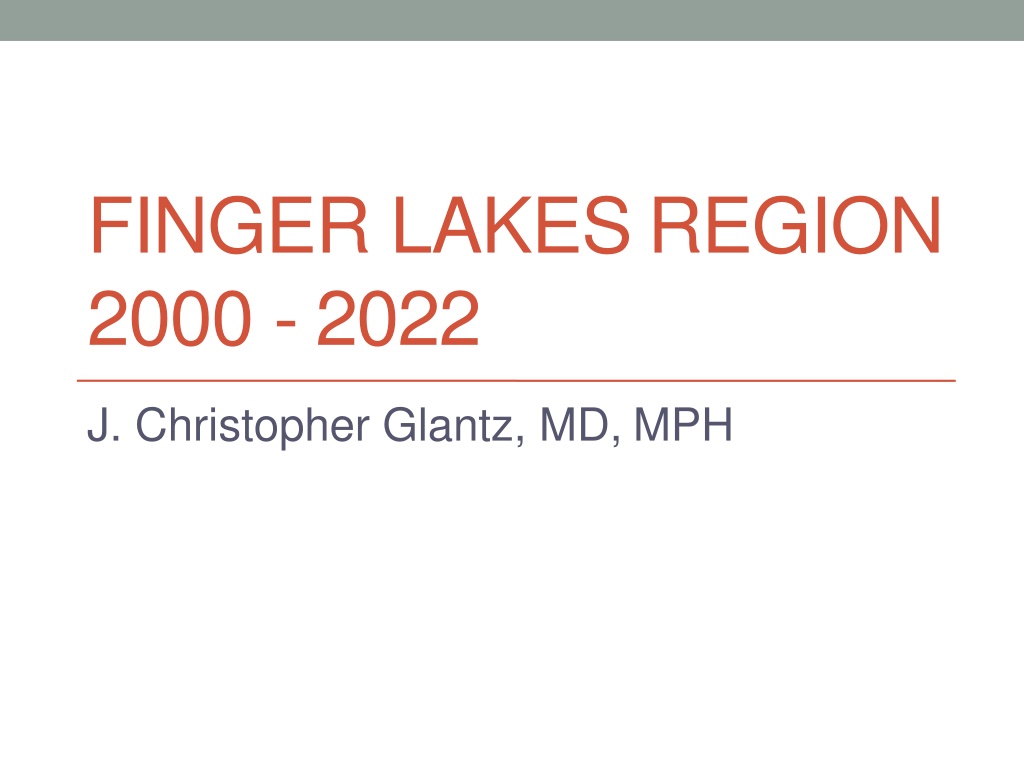
Maternity Trends in Finger Lakes Region 2000-2022
Maternity trends in the Finger Lakes region from 2000 to 2022 show a decline in hospital delivery volumes, with a decrease in the number of hospitals providing maternity services. Changes in delivery practices include increases in Medicaid coverage, epidural usage, and breastfeeding rates, while there were declines in forceps/vacuum and episiotomy procedures. Cesarean section rates have varied among hospitals, with indications for primary and all cesareans reflecting common trends in failure to progress and repeat cesareans being the most prevalent. Overall, the data highlights significant shifts in maternity care practices over the years.
Download Presentation

Please find below an Image/Link to download the presentation.
The content on the website is provided AS IS for your information and personal use only. It may not be sold, licensed, or shared on other websites without obtaining consent from the author. Download presentation by click this link. If you encounter any issues during the download, it is possible that the publisher has removed the file from their server.
E N D
Presentation Transcript
FINGER LAKES REGION 2000 - 2022 J. Christopher Glantz, MD, MPH
2022 Hospital DeliveryVolume Moms 3500 3151 3000 2732 2500 2000 1698 1403 1500 1010 1000 757 554 513 500 313 0 SMH HH RGH UH AO FFT CH NW NN
Regional Deliveries Since2000 Moms 18000 16000 14000 12000 10000 8000 6000 4000 2000 0 2000 2002 2004 2006 2008 2010 2012 2014 2016 2018 2020 2022 Down 23% from 2000 There were 14 hospitals with maternity services in 2000; in 2022, it was down to 9
Mics. Changes OverTime +26% 90 84.8 +93% 80 69.5 67.4 70 60 +44% PERCENT 50 45.5 +57% 36.1 40 32.0 31.7 -91% 30 21.6 20.4 -65% 20 8.4 10 2.9 2.0 0 Medicaid Breastfeeding Induction OpVagDel Epidural Episiotomy 2000 2022 Large increases in Medicaid, epidural, and breastfeeding rates; large declines in forceps/vacuum and episiotomy rates
CesareanSectionChangesoverTime 80 +7% 70 72.5 67.7 60 50 PERCENT 40 +30% -4% +37% 30 32 +27% 27.3 +34% 26.1 24.9 24.7 20 18.2 17.9 10 14.2 14.1 10.6 0 Total Primary Repeat "Low Risk" VBAC Attempt* VBAC Success* 2000 2022 All CS rates increased. TOLAC attempts and success have been fairly stable overall. *Data from 2004 was not readily available in 2000
Graphic FLR Cesarean Section since2000 35 30 25 Total Percent 20 Primary 15 Repeat 10 5 0 2000 2002 2004 2006 2008 2010 2012 2014 2016 2018 2020 2022 In 2022, total CS rates between hospitals ranged widely from 22% to 36% (was 15% to 28% in 2000). Cesarean rates declined over the past 22 years at Newark-Wayne and Nicholas Noyes, but rose at all other hospitals, the highest being at Corning where it more than doubled (from 15% in 2000 to 32% in 2022).
Indications for PrimaryCesarean (2022) 12% Failure to Progress/CPD 32% 23% Nonreassuring Fetal Status Malpresentation 33% Other Nonreassuring fetal status and failure to progress are the most common indications for primary cesarean
Indications for AllCesareans (2022) 14% 20% FTP/CPD 21% Malpresentation 16% RCS NRFS 29% Other The most common indication for any cesarean is repeat
Attempted Trial of Labor afterCS TOLAC 2022 35% 30% 25% PERCENT 20% 15% 10% 5% 0% AO RGH NW FFT UH HH SMH Hospitals vary in their rates of women laboring after previous cesarean section. Success rates ranged from 64% to 76% (difference not statistically significant).
Medicaid and Breastfeedingsince 2000 90 80 70 60 Percent 50 40 30 20 10 0 2000 2002 2004 2006 2008 2010 2012 2014 2016 2018 2020 2022 Medicaid Breastfeeding Breastfeeding rates have risen fairly consistently over the past two decades. Rates of Medicaid also have increased, but with a slight decline in the past two years.
Low Birth Weight and PretermDelivery 12 10 8 Percent 6 4 2 0 2000 2002 2004 2006 2008 2010 2012 2014 2016 2018 2020 2022 Low Birth Weight Preterm Delivery Rates of LBW and PTD have risen slightly in recent years, primarily due to an increase in late-preterm deliveries (deliveries below 34 wks not significantly changed)
NICU Admission and 5-min Apgar Score <7 16 14 12 10 Percent 8 ?? 6 4 2 0 NICU 5minApgar<7 NICU and Low Apgar scores have risen significantly over the past two decades. These increases remain significant even after adjusting for multiple possible cofactors. The reasons for the increases are unclear.
Summary 2000 -2022 Delivery volume has declined The percentage of women on Medicaid has increased Rates of labor induction and cesarean have increased Epidurals are widely available and breastfeeding is popular Operative vaginal deliveries (forceps and vacuum) and episiotomies are uncommon The rate of late-preterm delivery has risen in recent years NICU admissions and low 5-min Apgar scores have risen over the past 22 years
