Workforce Equality Standards and Gap Analysis 2022

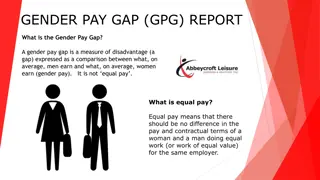
Workforce Equality Standards aim to provide insight into the experience and representation of disabled and BME staff within organizations, allowing for benchmarking and tracking progress. The Disability Equality Standard Results for 2022 show metrics related to the experiences of disabled staff compared to non-disabled staff, highlighting areas such as appointment likelihood, satisfaction with organizational values, incidents of bullying or harassment, and career progression opportunities. Gap Analysis is utilized to assess if the organization is narrowing the gap in experiences between disabled and non-disabled staff.

Download Presentation

Please find below an Image/Link to download the presentation.
The content on the website is provided AS IS for your information and personal use only. It may not be sold, licensed, or shared on other websites without obtaining consent from the author. Download presentation by click this link. If you encounter any issues during the download, it is possible that the publisher has removed the file from their server.
E N D
Presentation Transcript
Workforce Race Equality Standard Workforce Disability Equality Standard 2022 Return
Workforce Equality Standards Aimed to provide insight into the experience and representation of disabled staff and BME staff within the Trust. Provides that experience as a comparison with non- disabled and white staff within the Trust. Enables Trusts to benchmark themselves against similar Trusts. Trusts can track progress in narrowing the gap and reducing inequality of experience and representation.
Workforce Disability Equality Standard Results for publication 2022 WDES Metric Relative likelihood of disabled staff being appointed from shortlisting compared to that of non-disabled staff being appointed from shortlisting across all posts. 2018 n/a 2019 2020 2021 2022Benchmark 1.15 0.93 0.92 0.55 1.11 Relative likelihood of Disabled staff compared to non-disabled staff entering the formal capability process, as measured by entry into the formal capability procedure. n/a 1.54 33 0 0 0.54 48 1.94 44 Percentage of disabled staff satisfied with the extent to which their organisation values their work. Percentage of staff that felt that their employer had made adequate reasonable adjustments that enabled them to carry out their work. n/a 79 40 45 78 84 84n/a 79 Percentage of disabled staff who experienced at least one incident of bullying, harassment or abuse from patients, service users, their relatives or other members of the public. 31 38 29 31n/a 32 Percentage of disabled staff who experienced at least one incident of bullying, harassment or abuse from other colleagues in the past 12 months. 23 25 21 15n/a 20 Percentage of disabled staff who experienced at least one incident of bullying, harassment or abuse from managers 18 16 14 12n/a 13 Percentage of staff saying that the last time they experienced harassment, bullying or abuse at work, they or a colleague reported it. 60 58 55 62n/a 59 Percentage of disabled staff believing that Trust provides equal opportunities for career progression and promotion. 61 53 53 54n/a 54 Percentage of disabled staff compared to non-disabled staff saying that they have felt pressure from their manager to come to work, despite not feeling well enough to perform their duties. 28 28 28 19n/a 21 The staff engagement score for disabled staff, compared to non-disabled staff and the overall engagement score for the organisation. 6.6 6.5 6.7 7n/a 6.7 Percentage difference between the organisations Board voting membership and its overall workforce. -4 -5 -6 -10
Workforce Disability Equality Standard Gap Analysis We want to improve experiences for all staff. Sometimes pace of change can be slower for protected groups. Gap analysis is a useful tool to see if we are narrowing the gap between Disabled staff and non-Disabled staffs experiences. WDES Metric Gap Analysis Percentage of disabled staff satisfied with the extent to which their organisation values their work. Percentage of disabled staff who experienced at least one incident of bullying, harassment or abuse from patients, service users, their relatives or other members of the public. Percentage of disabled staff who experienced at least one incident of bullying, harassment or abuse from other colleagues in the past 12 months. Percentage of disabled staff who experienced at least one incident of bullying, harassment or abuse from managers Percentage of staff saying that the last time they experienced harassment, bullying or abuse at work, they or a colleague reported it. Percentage of disabled staff believing that Trust provides equal opportunities for career progression and promotion. Percentage of disabled staff compared to non-disabled staff saying that they have felt pressure from their manager to come to work, despite not feeling well enough to perform their duties. 2018 2019 2020 2021 Benchmark 15 9 11 6 8 7 14 9 7 7 9 8 7 3 8 10 4 6 3 6 2 2 4 0 2 3 3 6 6 6 10 11 11 2 6
Workforce Race Equality Standard Results for publication 2022 WRES Metric 2021 Benchmark 2017 2018 2019 2020 2021 2022 Relative Likelihood of White applicants being appointed from shortlisting compared to that of BME applicants 0.99 1.15 1.71 2.14 0.97 2.6 1.61 Relative likelihood of BME staff entering the formal disciplinary process, compared to that of White staff entering the formal disciplinary process 1.98 2 1.98 2.64 2.76 3.21 1.14 Relative likelihood of White staff accessing non-mandatory training and CPD compared to BME staff 1.05 1.04 1 1.02 1.05 1.03 1.14 Percentage of staff experiencing harassment, bullying or abuse from patients, relatives or the public in last 12 months 30 30 29 30 29 (30.2%) (29.9%) n/a 32 Percentage of staff experiencing discrimination at work from manager / team leader or other colleagues in last 12 months 20 16 18 19 17 n/a 14 Percentage of staff experiencing harassment, bullying or abuse from staff in last 12 months 24 28 34 25 23 n/a 23 Percentage of staff believing that the organisation provides equal opportunities for career progression or promotion 42 45 42 42 47 n/a 47
Workforce Race Equality Standard Gap Analysis We want to improve experiences for all staff. Sometimes pace of change can be slower for protected groups. Gap analysis is a useful tool to see if we are narrowing the gap between BME staff and White staffs experiences. WRES Metric 2017 2018 2019 2020 2021 2021 Benchmark 6 Percentage of staff experiencing harassment, bullying or abuse from patients, relatives or the public in last 12 months 1 5 3 9 5 Percentage of staff experiencing harassment, bullying or abuse from staff in last 12 months 4 7 12 6 6 5 Percentage of staff believing that the organisation provides equal opportunities for career progression or promotion 20 16 16 19 14 14 Percentage of staff experiencing discrimination at work from manager / team leader or other colleagues in last 12 months 13 10 13 13 12 8 Percentage of staff experiencing discimination at work from manager / team leader or other colleagues in last 12 months 13 11 13 13 12 8