Lagos State Government Ministry of Economic Planning and Budget 2016 Budget Performance Appraisal
This appraisal reviews the performance of Lagos State Government's 2016 budget, highlighting key implementation strategies, revenue sources, and allocation details. The budget focused on achieving the vision of becoming Africa's model megacity, emphasizing infrastructure development and economic growth. Observations and recommendations are provided to enhance future budget planning and execution.
Download Presentation

Please find below an Image/Link to download the presentation.
The content on the website is provided AS IS for your information and personal use only. It may not be sold, licensed, or shared on other websites without obtaining consent from the author. Download presentation by click this link. If you encounter any issues during the download, it is possible that the publisher has removed the file from their server.
E N D
Presentation Transcript
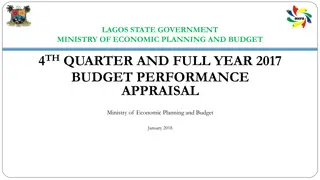
LAGOS STATE GOVERNMENT MINISTRY OF ECONOMIC PLANNING AND BUDGET 4thQUARTER AND FULL YEAR 2016 BUDGET PERFORMANCE APPRAISAL By Mr. Akinyemi Ashade, FCA Honourable Commissioner, Ministry of Economic Planning and Budget January 2017 4th Quarter & Full Year 2016 Budget Performance Appraisal
Outline Y2016 Budget Overview Y2016 Key Implementation Strategies Highlights of Budget Performance Review Observations and Recommendations Summary/Conclusion(s) 22 4th Quarter & Full Year 2016 Budget Performance Appraisal
Y2016 Budget Overview 33 4th Quarter & Full Year 2016 Budget Performance Appraisal
Y2016 Budget Y2016 Budget of N662.588bn was signed into law on 4 January 2016. SN Details Y2016 Budget (N bn) 1. Total revenue 542.874 2. Total recurrent expenditure (debt & non-debt) 275.655 Recurrent debt 13.151 The State s Vision and Mission: Recurrent non-debt Vision:Africa s model megacity, a global economic and financial hub that is safe, secure, functional and productive. a. Personnel cost 125.208 b. Overhead cost 137.296 3. Recurrent surplus 267.219 4. Capital expenditure 386.933 5. Financing (Surplus)/Deficit 119.714 a. External loans Mission: Eradicate poverty and promote economic growth through infrastructure renewal and development. i. World Bank - DPO 40.000 ii. Others 16.416 b. Internal loans 20.000 6. Bond issuance 43.298 7. Budget size 662.588 4 4th Quarter & Full Year 2016 Budget Performance Appraisal
Y2016 Budget: Details of Function Group Allocation Recurrent Capital N bn Total N bn Allocation Function group N bn % General public service 75.933 45.660 121.593 18.35 Public order and safety 14.506 13.625 28.131 4.25 Economic affairs 26.101 184.232 210.333 31.74 Environmental protection 19.803 33.296 53.099 8.01 Housing & community amenities 3.761 59.002 62.763 9.47 Health 44.912 19.766 64.678 9.76 Recreation, culture & religion 3.060 1.577 4.637 0.70 Education 85.365 27.964 113.329 17.10 Social protection 2.275 1.751 4.026 0.61 Total 275.715 386.873 662.588 100.00 5 5 4th Quarter & Full Year 2016 Budget Performance Appraisal
Y2016 Budget: Projected Revenue Sources and Capital to Recurrent Ratio Capital / Recurrent Ratio Projected Revenue Sources Capital Receipts 34.341 (6%) Federal Transfers 123.048 (23%) Recurrent, 42% Internally Generated Revenue- 385.485 (71%) Capital, 58% 6 4th Quarter & Full Year 2016 Budget Performance Appraisal
Y2016 Budget Key Implementation Strategies (1/2) Bi-weekly revenue stakeholders meeting as a vehicle for sustained revenue drive Monthly revenue tracking by the Governor Single billing, revenue automation, multi-channel revenue payment Enhanced transparency and accountability Efficient allocation of resources across sectors Periodic review of performance Tighter operational expenditure control Strict adherence to the Y2016 Budget Operational Guidelines 7 4th Quarter & Full Year 2016 Budget Performance Appraisal
Y2016 Budget Key Implementation Strategies (2/2) More effective and efficient project monitoring and evaluation Benchmark performance set at 100% Restructuring of internal loans Review of capital project implementation strategies Continuous Monitoring of Treasury Single Account (TSA) Quarterly budget performance appraisal Regular projects pre-payment inspection by MEPB to ensure value for money Maintenance of Capital to Recurrent ratio of 58 : 42 8 4th Quarter & Full Year 2016 Budget Performance Appraisal
Highlights of Budget Performance Review 9 4th Quarter & Full Year 2016 Budget Performance Appraisal
Q1 to Q4 Y2016 Budget Performance Review (1/2) Details Q4 Y2016 Q3 Y2016 Q2 Y2016 Q1 Y2016 Prov. Jan. Mar. Actual Jan. Mar. Prov. Actual Perf % Prov. Actual Jul. - Sep. Perf % Prov. Actual Perf % Perf % N bn Oct. - Dec. Oct. - Dec. Jul. - Sep. Apr. - Jun. Apr. - Jun. Total revenue (a) 135.719 132.166 97 135.719 97.324 72 135.719 97.086 72 135.719 101.695 75 Total capital receipts (b) 8.585 12.663 147 8.585 878 10 8.585 4.294 50 8.585 1.189 14 Recurrent expenditure (debt & non-debt) (c) = (d) + (e) + (f) 64.561 63.585 98 68.914 58.996 86 68.914 66.667 97 68.914 47.962 70 a. Recurrent debt (d) 3.288 4.812 146 3.288 4.216 128 3.288 4.058 123 3.288 4.176 127 b. Recurrent non-debt 61.273 58.772 96 65.626 54.780 83 65.626 62.609 95 65.626 43.786 67 i. Personnel cost (e) 25.552 25.043 98 31.302 24.274 78 31.302 24.097 77 31.302 21.900 70 ii. Overhead cost (f) 35.721 33.729 94 34.324 30.507 89 34.324 38.512 112 34.324 21.885 64 Recurrent surplus (g) =(a)- (c) 71.158 68.581 96 66.805 38.328 57 66.805 30.419 50 66.805 53.734 80 Capital expenditure (h) 101.087 122.841 122 96.733 51.168 53 96.733 66.740 69 96.733 48.884 51 Financing requirement (deficit)/surplus (i) = (g) (h) (29.929) (54.260) 181 (29.929) (12.840) 48 (29.928) (36.321) 121 (29.928) 4.850 0 Budget size (j) = (c) +(h) 165.647 186.426 113 165.647 110.164 67 165.647 133.407 81 165.647 96.846 58 10 4th Quarter & Full Year 2016 Budget Performance Appraisal
Q1 to Q4 Y2016 Budget Performance Review (2/2) Q4 performance of N186.426bn/113% was above projection by N20.779bn due to draw down of the bond, higher than N110.164bn/67% in Q3; N133.407bn/81% in Q2 and N96.846bn/58% in Q1. Total Revenue (TR) recorded N132.166bn/97% higher than N97.324bn/72% in Q3; N97.086bn/72% in Q2 and N101.695bn/75% in Q1. The Overhead Cost for Q4 performed at N33.729bn/94% compared to N30.507bn/89% in Q3; N38.512bn/112% in Q.2 and N21.885bn/64% in Q1 Capital Expenditure performed at N122.841bn/122% higher than N51.168bn/53% in Q3, N66.740bn/69% in Q2 and N48.884bn/51% in Q1. 11 4th Quarter & Full Year 2016 Budget Performance Appraisal
Comparative Analysis of Cumulative (Jan. - Dec.) Budget Performance for Y2015 to Y2016 Details Y2016 Actual Jan. - Dec. Y2015 Actual Jan. - Dec. Overall, performance was N528.664bn /80% higher than N350.676bn/72% in Y2015 due to DPO III and draw down of bond. The deficit of N92.336bn was funded through DPO III and Bond Issuance. Total Revenue performed at N436.328bn/80% but higher in absolute terms, than N399.382bn/82% in Y2015. Recurrent Expenditure performed at N237.932bn/92% higher in absolute terms to N223.003bn/92% in Y2015. The improvement in non-debt recurrent expenditure performance was as result of tighter expenditure control. Capital Expenditure closed at N290.731bn/72% better than N127.673bn/52% in 2015 Prov. Perf % Prov. Perf % N bn Jan. - Dec. Jan. - Dec. Total revenue (a) 436.328 80 82 542.874 489.690 399.382 Total capital receipts (b) 21.582 63 39 34.341 20.976 8.160 Recurrent expenditure (debt & non-debt) (c) = (d) + (e) + (f) a. Recurrent debt (d) b. Recurrent non-debt i. Personnel cost (e) ii. Overhead cost (f) Recurrent surplus (g) =(a)- (c) 237.932 92 241.977 223.003 92 258.242 17.261 220.671 96.037 124.634 131 90 94 87 0 0 0 92 87 97 13.151 245.091 102.209 142.882 241.977 113.300 128.677 223.003 98.537 124.466 177.917 63 71 284.632 247.713 176.379 Capital expenditure (h) 290.731 72 52 404.347 247.713 127.673 Financing requirement (deficit)/surplus (i) = (g) (h) (92.336) 77 - (119.715) - 48.706 Budget size (j) = (c) +(h) 528.664 80 72 662.588 489.690 350.676 12 4th Quarter & Full Year 2016 Budget Performance Appraisal
Comparative Analysis of Q4 Budget Performance from Y2015 to Y2016 Details Y2016 Actual Oct. - Dec. 132.166 Y2015 Actual Oct. - Dec. 98.546 3.254 The Budget performance for Q4 Y2016 was 113% compared to 91 % in Q4 Y2015. Capex was 122% in Q4 Y2016 compared to 99% in Q4 Y2015. Reclassification of Recurrent expenditure to Recurrent Debt and non Recurrent Debt commenced in Y2016. Prov. Perf % 97 Prov. Perf % 80 N bn Oct. - Dec. 135.719 Oct. - Dec. 122.423 5.244 Total revenue (a) 62 Total capital receipts (b) 8.585 12.663 147 Recurrent expenditure (debt & non-debt) (c) = (d) + (e) + (f) a. Recurrent debt (d) b. Recurrent non-debt i. Personnel cost (e) ii. Overhead cost (f) Recurrent surplus (g) =(a)- (c) 64.561 63.585 98 0 0 0 3.288 61.273 25.552 35.721 4.812 58.772 25.043 33.729 146 96 98 94 0 0 0 83 86 81 60.494 28.325 32.169 50.330 24.238 26.092 61.928 48.216 78 71.158 68.581 96 61.928 61.576 99 Capital expenditure (h) 101.087 122.841 122 Financing requirement (deficit)/surplus (i) = (g) (h) - (13.359) - (29.929) (54.260) 181 Budget size (j) = (c) +(h) 165.647 186.426 113 122.423 111.906 91 13 4th Quarter & Full Year 2016 Budget Performance Appraisal
Full Year 2016 Revenue Appraisal (1/3) Provision Actual Performance % Details (Jan. Dec. 2016) (Jan. Dec. 2016) N bn 542.874 419.826 385.485 300.000 61.567 21.418 0.800 1.700 34.341 123.048 50.239 72.809 N bn 436.328 312.830 291.248 247.022 30.583 10.436 3.207 Total Revenue (A+B+C) Total Internally Generated Revenue (A+B) A. Internally Generated Revenue I. Lagos State Internal Revenue Services (LIRS) II. Internally Generated Revenue (Others) III. Dedicated Revenue IV. Investment Income V. Extra Ordinary Revenue B. Capital Receipts C. Federal Transfers I. Statutory Allocation II. Value Added Tax 80 75 76 82 50 49 401 0 63 100 67 104 - 0 21.582 123.498 33.597 75.401 14.500 III. Extra Ordinary Revenue 0 14 4th Quarter & Full Year 2016 Budget Performance Appraisal
Full Year 2016 Revenue Appraisal (2/3) % of Actual Performance Federal Transfers 28% Capital Receipt 5% IGR 67% 15 4th Quarter & Full Year 2016 Budget Performance Appraisal
Full Year 2016 Revenue Appraisal (3/3) Total Revenue ( TR ) performed at N436.328bn/80% of target compared to N399.382bn/82% in Y2015; N36.946bn more in absolute terms. Total Revenue Total Internally Generated Revenue ( TIGR ) was N312.830bn/75%, against N274.946/80% in Y2015 and represents 72% of TR vs 69% in Y2015. Total IGR Dedicated Revenue performance amounted to N10.436bn/49%, which is equivalent to 3% of TIGR and 2% of the TR. Dedicated Revenue LIRS performance of N247.022bn/82% accounted for 79% of the TIGR and 57% of the TR, compared to N225.041bn/81%; 79% of TIGR and 56% of TR in Y2015; N21.981bn more in absolute terms. LIRS Capital receipts performed at N21.582bn/63%, 7% of TIGR and 5% of TR respectively. Capital Receipts Federal transfers contributed N123.498bn/100%; 28% of the TR; Statutory Allocation (SA) contributed N33.597bn/67%, while VAT performed at N75.401bn/104% of provision. Federal Transfers 16 4th Quarter & Full Year 2016 Budget Performance Appraisal
Full Year Total Revenue Actuals for Y2014 Y2016 436.328 440.000 430.000 407.475 420.000 399.382 410.000 400.000 390.000 380.000 2016 2015 2014 17 4th Quarter & Full Year 2016 Budget Performance Appraisal
Comparative of Monthly IGR for Y2014 Y2016 40 35 30 25 20 15 2014 10 2015 5 2016 0 JAN 27.802 FEB 26.626 MAR 21.627 APRIL 27.643 MAY 22.244 JUNE 25.487 JULY 21.649 AUG 23.252 SEPT. 26.268 Oct. 39.591 Nov. 32.055 Dec. 38.334 2016 2015 25.243 21.582 23.697 24.058 20.217 23.06 20.591 20.437 28.039 19.516 21.779 24.345 2014 23.356 20.469 18.392 29.308 21.405 22.105 18.176 19.033 17.923 19.391 19.893 25.333 2016 2015 2014 18 4th Quarter & Full Year 2016 Budget Performance Appraisal
Comparative of Monthly Revenue of LIRS for Y2014 Y2016 25 20 15 10 2014 5 2015 2016 0 JAN FEB MAR APR MAY JUN JUL AUG SEP OCT NOV DEC LIRS 2016 2015 2014 24.525 21.996 20.319 22.515 18.484 16.393 20.205 19.169 15.525 20.417 20.196 23.171 18.591 17.854 17.238 18.92 19.952 17.776 18.079 17.87 16.044 19.682 16.936 18.571 18.713 7.803 11.846 19.057 16.712 16.561 18.468 19.018 16.82 24.675 21.924 22.402 2016 2015 2014 19 4th Quarter & Full Year 2016 Budget Performance Appraisal
Actual Revenue Performance as at 31 December 2016 (1/2) Cumulative Estimates Cumulative Actual Performance % SN Ministry/Department/Agency N bn N bn Lagos State Infrastructural Maintenance& Regulatory Agency (LASIMRA) 1 0.500 1.237 247 2 Lands Bureau 13.250 20.484 155 3 Ministry of Transportation 2.180 2.263 104 4 Lagos State Examination Board 0.800 0.692 86 5 Office of the Surveyor-General 0.900 0.754 84 6 Ministry of Education 0.525 0. 426 81 7 Motor Vehicle Administration Agency Lagos State Physical Planning Permit Authority(LAPPPA) Lagos State Signage and Advertisement Agency (LASAA) 5.884 4.201 71 8 4.500 3.096 69 9 0.554 0.327 59 20 4th Quarter & Full Year 2016 Budget Performance Appraisal
Actual Revenue Performance as at 31 December 2016 (2/2) Cumulative Estimates Cumulative Actual Performance % SN Ministry/Department/Agency N bn N bn 10 Lagos State High Courts 2.450 1.453 59 11 Lagos State Traffic Management Agency(LASTMA) 1.050 0.607 58 12 Ministry of Finance 12.016 4.788 40 13 Ministry of Health 0.584 0.207 35 14 L/S Public Procurement Agency 2.000 0.534 27 15 Ministry of Tourism, Arts & Culture 0.511 0.122 24 16 State Treasury Office 0.665 0.100 15 17 Water Regulatory Commission 1.000 0.101 10 Ministry of Waterfront Infrastructure Development 18 6.823 0.453 7 21 4th Quarter & Full Year 2016 Budget Performance Appraisal
% Actual Revenue Performance as at 31 December 2016 300 247 250 200 155 150 104 86 84 100 81 71 69 59 59 58 40 35 50 27 24 15 10 7 0 22 4th Quarter & Full Year 2016 Budget Performance Appraisal
Full Year 2016 Capital Receipts Appraisal Provision Actual Performance % Details (Jan. Dec. 2016) (Jan. Dec. 2016) N bn N bn Grants (Donor agencies) 8.757 4.153 47 Other capital receipts 25.584 17.429 68 Total capital receipts 34.341 21.582 63 23 4th Quarter & Full Year 2016 Budget Performance Appraisal
Half Year Capital Receipts Performance From Y2010 to Y2016 Provision (Jan. Jun.) Actual Performance % Year (Jan. Jun.) N bn N bn 28.372 12.087 43 2010 19.261 9.313 48 2011 25.677 9.613 32 2012 10.912 6.848 63 2013 23.184 7.295 31 2014 20.976 8.160 39 2015 2016 34.341 21.582 63 24 24 4th Quarter & Full Year 2016 Budget Performance Appraisal
Full Year 2016 Expenditure Appraisal 25 4th Quarter & Full Year 2016 Budget Performance Appraisal
Full Year 2016 Personnel Cost Performance Appraisal Total Personnel Cost (TPC) was N96.037bn/94%, recording a decrease of N2.500bn over the same period in Y2015 at N98.537/87%. The TPC was 22% of Total Revenue(TR). TPC at 31% of IGR is within Wage Policy of maximum 25% of TR and 35% of IGR. Provision (Jan. Dec.) Actual Performance % Year (Jan. Dec.) N bn N bn 55.079 53.947 98 2010 71.429 73.995 104 2011 81.625 76.550 94 2012 83.958 80.428 96 2013 88.221 84.922 96 2014 113.300 98.537 87 2015 102.209 96.037 94 2016 26 4th Quarter & Full Year 2016 Budget Performance Appraisal
Full Year Overhead Costs Performance From Y2014 - Y2016 Details Y2016 Y2015 Y2014 Prov. N bn Actual N bn Perf % Prov. N bn Actual N bn Perf % Actual N bn Perf % Prov. N bn Total Overhead Costs 142.882 124.634 87 128.677 124.466 97 153.644 145.728 95 Overhead Costs 107.674 123 87.692 68.705 68.765 100 78.177 78.112 100 Dedicated Expenditure 0.049 0 21.418 19.551 19.080 98 19.970 12.555 63 Subvention 16.911 50 33.772 16.156 15.812 98 32.152 32.062 100 External Debt Charges 0 0 0 2.185 2.856 131 0.922 1.847 200 Internal Debt Charges 0 0 0 22.080 17.953 81 22.423 21.152 94 Total Overhead Cost performed N124.634bn/87%; representing 52% of the Total Recurrent Expenditure and 40% of IGR compared with N124.466bn/97% which represent 56 % of the Total Recurrent Expenditure and 45% of IGR in 2015. Overhead subventions to Parastatal organizations/tertiary institutions performed at N16.911bn/50% as against N15.812bn/98% in Y2015. Parastatal organizations including tertiary institutions still showed continuous dependence on subventions from the State Government, instead of improving on their IGR. There is need to check this trend. 27 4th Quarter & Full Year 2016 Budget Performance Appraisal
Full Year Recurrent Expenditure From Y2010 - Y2016 Provision (Jan. Dec.) Actual Performance % Year (Jan. Dec.) N bn N bn 178.015 156.148 88 2010 198.182 183.845 93 2011 233.620 207.366 89 2012 214.729 199.377 93 2013 241.865 230.650 95 2014 241.977 223.003 92 2015 258.242 237.932 92 2016 28 4th Quarter & Full Year 2016 Budget Performance Appraisal
Capital Expenditure and Financing Activities Appraisal 29 4th Quarter & Full Year 2016 Budget Performance Appraisal
Capital Expenditure: Comparative Full Year Performance From Y2014 - Y2016 Details Y2016 Y2015 Y2014 Prov. N bn Actual N bn Perf % Prov. N bn Actual N bn Perf % Prov. N bn Actual N bn Perf % Core capital 287.227 222.770 78 114.598 54 166.031 77 213.577 215.346 Capital development 25.584 0.672 3 0.222 2 1.067 6 13.880 17.884 0.042 56 Risk Retention Fund 0.100 0 0 0.100 0.075 Special expenditure 3.416 4.031 118 3.808 85 4.728 86 4.500 5.500 8.757 4.153 47 3.286 46 2.114 40 Grants from Donor agencies 7.096 5.300 Counterpart Fund 6.094 0.929 15 4.608 63 3.500 100 7.350 3.500 Contingency Reserve 0.578 0.570 99 1.152 99 0.071 49 1.160 0.145 Staff Housing Fund 0.100 0 0 0.050 100 0.050 0.050 External Loans (principal repayments) 1.646 4.617 281 0.000 0.000 0.00 0.000 0.000 0.000 Internal loans (principal repayments) 20.000 9.525 48 0.000 0.000 0.00 0.000 0.000 0.000 Consolidated service account Total 50.845 404.347 43.463 290.731 85 72 0.000 0.000 0.00 0.000 0.000 0.000 247.713 127.674 52 247.8 177.603 71.672 30 4th Quarter & Full Year 2016 Budget Performance Appraisal
Financing Activities: Comparative Full Year Performance From Y2014 - Y2016 Details Y2016 Y2015 Y2014 Prov. N bn Actual N bn Perf % Prov. N bn Actual N bn Perf % Actual N bn Perf % Prov. N bn Financing Financing (sources) 119.714 103.794 87 48.780 54 99.746 100.411 105 90.818 External loans 56.416 47.794 85 56.542 14.504 i. DPO 40.000 39.526 99 32.000 - - 30.000 31.500 101 ii. Others 16.416 8.268 50 24.542 14.504 59 13.080 13.245 101 Internal loans 0 0 34.276 34.276 100 55.666 98 56.666 Bond issue 63.298 56.000 88 0 0 0 90.818 Repayments 72.491 57.606 79 1.689 100.469 111 99.746 98.312 74 External loans (principal repayments) 1.646 4.617 281 27.384 1.087 64 0.768 0.576 75 Internal loan (principal repayments) 20.000 9.525 48 61.745 43.492 159 34.985 27.162 78 Consolidated debt service accounts 50.845 43.463 85 32.000 55.889 91 63.993 46.566 73 31 4th Quarter & Full Year 2016 Budget Performance Appraisal
Full Year 2016 Capital Expenditure and Financing Activities Appraisal Capital Expenditure Cumulative performance was N290.731bn/72% as against N127.673bn/52% the same period in Y2015. As at end of Q4 2016, the cumulative Capex: Recurrent ratio was 55:45 as against the 61:39 budget target. The draw down of Bond issuance supported the Capital Expenditure performance. Financing Activities Financing Activities for (Jan-Dec) Y2016 showed a net revenue deficit of N12.338bn. The State repaid N57.606bn as debt obligation. Y2016 approved budget was estimated to be supported by financing requirement of N29.929bn on a quarterly basis. 32 4th Quarter & Full Year 2016 Budget Performance Appraisal
Observations/Recommendations (1/4) 1.0 Revenue: 1.1 Deliberate efforts must be made to achieve the N30bn monthly IGR target to enhance performance of Capital Projects and others. 1.2 All MDAs will have to meet their revenue projections to ensure that IGR performs well over 100% to meet up with the shortfall due to decline in Federal Transfers. 1.3 LIRS performance on a monthly basis though not consistent, improved towards the end of the year and needs to be improved upon to achieve 100% performance. 1.4 LIRS needs to surpass its current performance to support IGR 1.5 The LUC needs to ramp up its revenue generating efforts to cover areas that are yet to be enumerated across the State including enforcement activities. 33 4th Quarter & Full Year 2016 Budget Performance Appraisal
Observations/Recommendations (2/4) 2.0 Recurrent Expenditure: 2.1 Personnel Costs: Personnel Cost performance of N96.037bn/94% is still within Budget, lesser in absolute term compared to N98.537/87% in Y2015 and within the World Bank recommended ratios. 2.2 Overhead Expenditure: The Total Overhead Cost was observed to be running at N124.634bn/87% which needs to be moderated and tied to revenue performance of revenue generating agencies. 34 4th Quarter & Full Year 2016 Budget Performance Appraisal
Observations/Recommendations (3/4) 3.0 Capital Expenditure: The Total Capital Expenditure at 72% reveals a Capex/Recurrent ratio (55:45), though impressive but should be improved upon. We need to increase support for delivery of infrastructure in areas such as road rehabilitation, transportation, security, environment, etc. to drive performance further. MDAs must exhaust proposed capital expenditures within their budgetary provisions before seeking for State Wide Votes from MEPB. 35 4th Quarter & Full Year 2016 Budget Performance Appraisal
Observations/Recommendations (4/4) 4.0 Financing: Draw down of DPO III, Bond Issuance as well as Internal Loans enhanced delivery of capital projects. 36 4th Quarter & Full Year 2016 Budget Performance Appraisal
Conclusion: The EXCO is Invited to Note: Y2016 Budget size was N662.588bn, with Intra-Function Group reordering. Budget Size Q4 Y2016 performed at N186.426bn/113%; compared to N111.906bn/91% for same period in Y2015. while the cumulative performance was N528.664bn/80%; compared to N350.676bn/72%; for same period in Y2015. Q4 Performance Total Revenue performance was N436.328bn/80% compared to N399.382bn/82% in Y2015. Total Revenue Capital Receipts Total Capital Receipts for the period amounted to N21.582bn/63%. Total Recurrent Expenditure for the period performed N237.932bn/92% (Total Personnel Cost N96.037bn/94%; Total Overhead Cost N124.634bn/87%). Recurrent Expenditure Capital Expenditure Total Capital Expenditure performance was N290.731bn/72%. Bonds and DPO III have been drawn down. Debt 37 4th Quarter & Full Year 2016 Budget Performance Appraisal
Itesiwaju Ipinle Eko Lo je wa logun! Thank you. Comments, Observations & Questions? 38 4th Quarter & Full Year 2016 Budget Performance Appraisal
