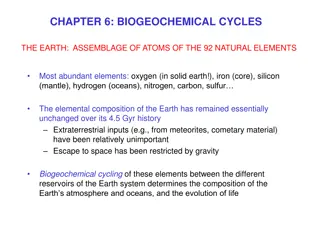
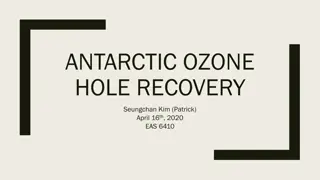
The Role of Sunlight, Ozone, and Plant Life in Earth's Atmosphere
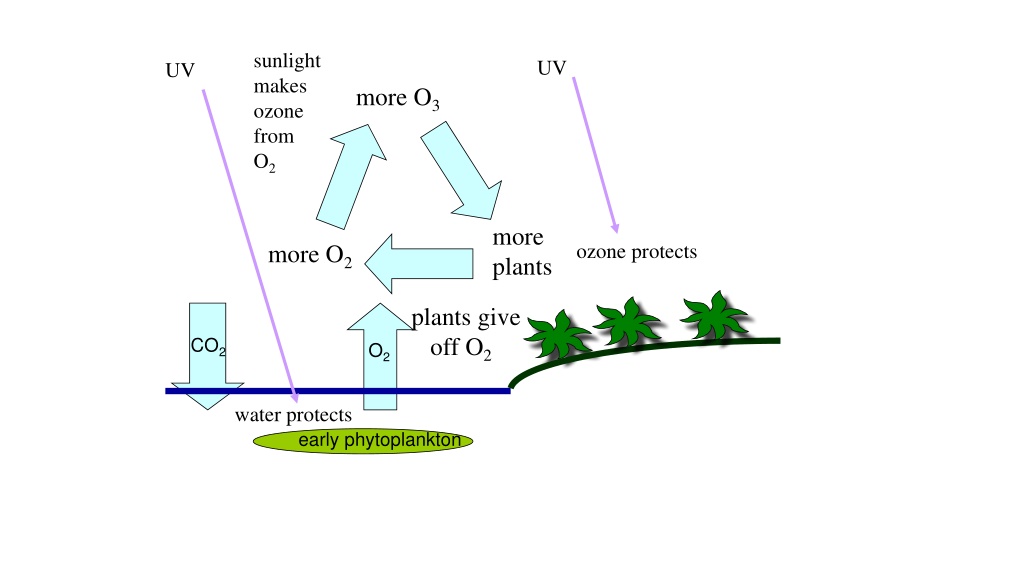
Figure 1.3.
Variations over the past
420,000 years in the 3200-m deep ice
core from Vostok, Antarctica [Petit et
al. 1999, 2001] of a) Deuterium
anomaly (pptv, left axis), with
estimated global temperature
anomaly (Kelvins, right axis), b)
carbon dioxide (ppmv), and c)
methane (ppbv) [from
www.ncdc.noaa.gov/paleo].
XUV < 0.2
μ
m
UV 0.2-0.3
μ
m
VIS + near IR 0.3 – 2.0
μ
m
Troposphere
Stratosphere
Mesosphere
Thermosphere
tropics
U.S. Standard Atmosphere
Tropopause
Stratopause
Mesopause
Altitude (km)
Pressure (hPa)
Density (kg / m
3
) * 1000
O
Gravity
Pressure Gradient Force
lower pressure
higher pressure
Air Parcel
Pressure (atmospheres)
Density (kg / m
3
)
Depth
(m)
Figure 2.1. The electromagnetic spectrum.
Figure 2.2. a) The solar and earth emission spectra, b) percent absorption for the whole
atmosphere, and c) percent absorption for the part of the atmosphere that lies above 11 km.
Figure 3.1. The global average vertical energy transfer processes between space,
the atmosphere, and the surface, including solar radiation (left), infrared radiation
(middle), and vertical transport by atmospheric motions (right).
Space
Atmosphere
Surface
Incoming
Reflected
30
100
20 absorbed
50 absorbed
70 emitted up
90 emitted
(288 K)
Air Motions
30
Latent and
Sensible Heat
Transport
(255 K)
70 emitted
down
Solar Radiation
Infrared Radiation
Why Are The Poles Cold ?
Due to the spherical shape of the earth, the sun’s rays
are concentrated in the tropics and spread out at the poles.
Figure 3.2. Annual and zonal average absorbed solar (solid) and emitted longwave
(dashed) radiation in W m
2
. The difference between absorbed solar and emitted
infrared radiation, the net radiation into the earth system, is shown below.
Axial Tilt, Elliptical Orbit, and the Seasons
A conundrum: The earth receives ~7% more radiation from the sun
on January 4 compared to on July 4, so why is the earth’s average
temperature less in January than in July?
Figure 3.12 Idealized ocean currents [Ahrens].
Figure 3.13. Vertical section along the equatorial Pacific showing the sloping thermocline,
contour interval 1 K [www.cpc.noaa.gov].
Figure 3.7. Idealized monsoon circulations corresponding to a) summer and
the tropics, and b) winter and polar regions.
Figure 3.11. The Ekman spiral in the upper layer of the ocean for the Northern
Hemisphere [Ahrens].
Order-one interactions between the
atmosphere and the ocean
Ocean temperature anomalies
heat and cool the atmosphere
Wind stress causes currents,
ocean gyres, upwelling
Latent heat transport
linked to ocean
salinity
Extra heat and CO
2
stay
in ocean for ~1000 yr
Figure 3.14. Average surface salinity during August, contour interval 0.2 ppt
[World Ocean Atlas 2001].
Figure 3.16. Idealized “conveyor belt” view of the thermohaline circulation, with sinking
in the North Atlantic, spreading throughout the deep ocean, rising, and return at the surface.
Wallace and Thompson, 2002, Phys Today,
Figure 3
Surface Air Temperature Differences
High – Low NAM index
o
C
Thompson and Wallace 2001
High Index NAM
Low Index NAM
500 hPa
Sunlight plays a crucial role in the formation of ozone from oxygen, leading to the protection of plant life against harmful UV radiation. The ozone produced by sunlight helps in the photosynthesis process of plants, which in turn release oxygen, absorb CO2, and contribute to the overall balance of gases in the atmosphere. This positive feedback loop among sunlight, ozone, and plants has enabled life to thrive and evolve on land, safeguarding early phytoplankton and promoting a sustainable ecosystem. The atmospheric composition, volcanic emissions, past climate variations, and atmospheric layers further illustrate the intricate interplay of various elements in Earth's dynamic system.

Download Presentation

Please find below an Image/Link to download the presentation.
The content on the website is provided AS IS for your information and personal use only. It may not be sold, licensed, or shared on other websites without obtaining consent from the author. Download presentation by click this link. If you encounter any issues during the download, it is possible that the publisher has removed the file from their server.
E N D
Presentation Transcript
sunlight makes ozone from O2 UV UV more O3 more plants ozone protects more O2 plants give off O2 CO2 O2 water protects early phytoplankton Figure 1.8 Life colonized the land surface via the positive feedback among photosynthesis, ozone, and UV protection.
Present Atmospheric Composition 78% N2 21% O2 1% Ar Trace S 0.041% CO2 0-4% H2O Volcanic Emissions Trace N2 Trace O2 Trace Ar Trace S 10% CO2 85% H2O Table 1.1. A comparison of the concentrations of gases in the present atmosphere and in modern volcanic emissions.
???????????? ?????? ? + ?2? + ??2 ?2+ ??????????? 1.1 ????????? (??????????) ?????? + ?2? + ??2 ?2+ ??????????? (?????? ?????) 1.2
-410 2 K -420 0 K -430 -440 -450 -460 -470 -480 -10 K -490 0 50000 100000 150000 200000 250000 300000 350000 400000 450000 300 275 250 Figure 1.3. Variations over the past 420,000 years in the 3200-m deep ice core from Vostok, Antarctica [Petit et al. 1999, 2001] of a) Deuterium anomaly (pptv, left axis), with estimated global temperature anomaly (Kelvins, right axis), b) carbon dioxide (ppmv), and c) methane (ppbv) [from www.ncdc.noaa.gov/paleo]. 225 200 175 0 50000 100000 150000 200000 250000 300000 350000 400000 450000 800 750 700 650 600 550 500 450 400 350 300 0 50000 100000 150000 200000 250000 300000 350000 400000 450000 ybp
100 XUV < 0.2 m Thermosphere 90 Mesopause 80 70 Mesosphere 60 50 Stratopause UV 0.2-0.3 m 40 Stratosphere 30 tropics U.S. Standard Atmosphere 20 Tropopause 10 VIS + near IR 0.3 2.0 m Troposphere 0 160 180 200 220 240 260 280 300 320
50 Altitude (km) 45 40 35 lower pressure O 30 Pressure Gradient Force Air Parcel 25 Gravity 20 higher pressure 15 10 Density (kg / m3) * 1000 Pressure (hPa) 5 0 0 200 400 600 800 1000 1200
0 100 200 300 400 500 600 700 800 900 1000 1100 0 Depth (m) Density (kg / m3) Pressure (atmospheres) 1000 2000 3000 4000 5000 6000
Figure 2.2. a) The solar and earth emission spectra, b) percent absorption for the whole atmosphere, and c) percent absorption for the part of the atmosphere that lies above 11 km.
Why Are The Poles Cold ? Less W m-2 } More W m-2 Due to the spherical shape of the earth, the sun s rays are concentrated in the tropics and spread out at the poles.
Figure 3.2. Annual and zonal average absorbed solar (solid) and emitted longwave (dashed) radiation in W m2. The difference between absorbed solar and emitted infrared radiation, the net radiation into the earth system, is shown below.
Axial Tilt, Elliptical Orbit, and the Seasons Mar 21 Equinox axial tilt 23.5 152 x 106 km 147 x 106 km June 21 Solstice Dec 21 Solstice Sept 21 Equinox A conundrum: The earth receives ~7% more radiation from the sun on January 4 compared to on July 4, so why is the earth s average temperature less in January than in July?
Figure 3.13. Vertical section along the equatorial Pacific showing the sloping thermocline, contour interval 1 K [www.cpc.noaa.gov].
Figure 3.7. Idealized monsoon circulations corresponding to a) summer and the tropics, and b) winter and polar regions.
Figure 3.11. The Ekman spiral in the upper layer of the ocean for the Northern Hemisphere [Ahrens].
Figure 3.14. Average surface salinity during August, contour interval 0.2 ppt [World Ocean Atlas 2001].
Figure 3.16. Idealized conveyor belt view of the thermohaline circulation, with sinking in the North Atlantic, spreading throughout the deep ocean, rising, and return at the surface.
La Ni na El Ni no Warm Warm Cold Peru Peru Indonesia Indonesia Strong Walker Circulation Steeply-sloping thermocline Cold SST/dry near Peru Wet near Indonesia Large Tahiti-Darwin SLP diff. Weak Walker Circulation Flat thermocline Warm SST/wet near Peru Dry near Indonesia Small Tahiti-Darwin SLP diff.
Surface Air Temperature Differences High Low NAM index oC Wallace and Thompson, 2002, Phys Today, Figure 3
High Index NAM Low Index NAM 500 hPa Thompson and Wallace 2001


 The solar and earth emission spectra, b)")

")