Work Environment and Health Insights at NAFEA Cooley
NAFEA Cooley's work environment provides plenty of natural light, electronic prompts, and promotes physical well-being. Employees have various options for their workspaces and exhibit different levels of alcohol consumption and perceived health categories. The survey also reveals insights on workload, stress levels, and opinions voiced at work.
Download Presentation

Please find below an Image/Link to download the presentation.
The content on the website is provided AS IS for your information and personal use only. It may not be sold, licensed, or shared on other websites without obtaining consent from the author. Download presentation by click this link. If you encounter any issues during the download, it is possible that the publisher has removed the file from their server.
E N D
Presentation Transcript
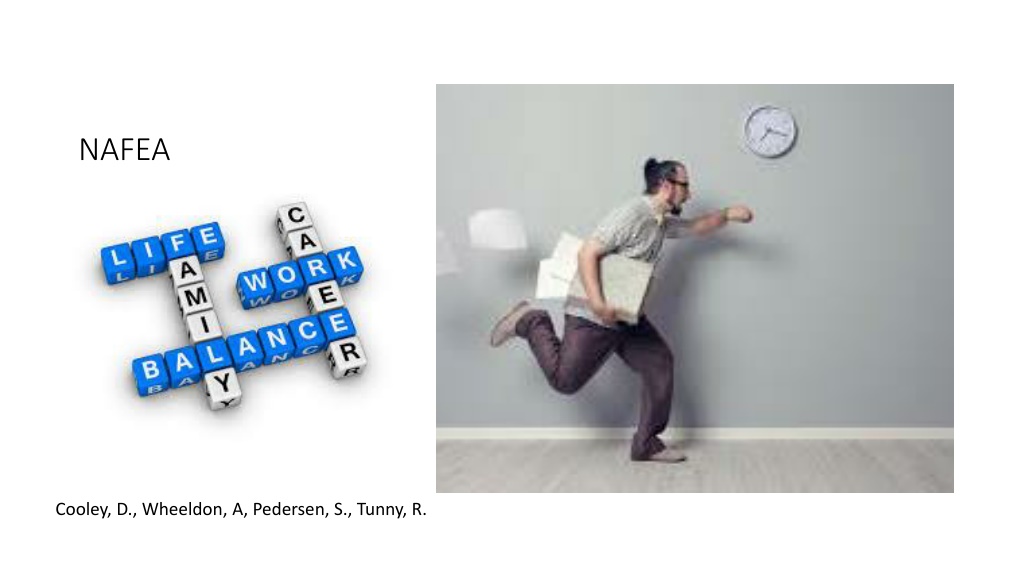
NAFEA Cooley, D., Wheeldon, A, Pedersen, S., Tunny, R.
Who are we? 15 21 Year 12 Certificate/Diploma Undergraduate Degree 18 Post Graduate Degree 32
Working Conditions There is plenty of natural light Electronic prompts / reminders/software My work environment promotes physical Job tasks are rotated Air conditioning is available Per cent agreeing There is plenty of natural light Break out rooms are available for meetings Ergonomic assessments are available EAP are available Standing desks are optional 0.00% 5.00% 10.00% 15.00% 20.00% 25.00% Working Space Own office Open plan no cubicles Open plan own cubicle Open plan share a cubicle 10% 10% 56% 24%
Alcohol Consumption per week How healthy are we? 4 or more times a WEEK 2 to 3 times a WEEK Yes 2 to 4 times a MONTH Monthly or less Never 0.00% 5.00% 10.00% 15.00% 20.00% 25.00% 30.00% 35.00% On the days you do drink, how many do you drink? More than 10 9 to 10 7 to 8 YES 5 to 6 3 to 4 1 to 2 drinks 0.00% 10.00% 20.00% 30.00% 40.00% 50.00% 60.00% 70.00%
The frequency that I am asked for my opinion What is work like? How have things changed over the last 2 years? My suggestions are listen to Supervisors treatment Better The same Training for the job Worse Work Intensity Physical Conditions 0 10 20 30 40 50 60 70 What is your current workload? Light 4 Balanced 15 Heavy 27 Per cent Stressful 31 Cannot sustain 23 0 5 10 15 20 25 30 35
Health Wellness Categories Worried Well relative few unhealthy conditions but low perceived health Truly Health few unhealthy conditions and high perceived health Health Evaders relative large number of unhealthy behaviours & low perceived health Health Illusionists relative large number of unhealthy behaviours but high perceived health 19 22 Truly Healthies Health Evaders Health Illusionists Worried Well 23 35
Worried Well Relatively low perceived health (M=6.3 on a 10-point scale) Less likely to have any of the conditions included in the survey. Possible reason for their lower perceived health scores, is the proportion that say they are overweight or would like to loss 5 kg or more (24%). Low work related stress factors Most days look forward to going to work (57%) Motivated by work (7.9 on a 10- point scale) and feel useful at work (8.0 on a 10- point scale)
Truly Healthy This segment is the healthiest, in self- perception and reality. The highest perceived health (8.4 on a 10- point scale) Least likely to have any of the conditions included in the survey Low work related stress factors - more satisfied with their jobs Most days I look forward to going to work (53%) High motivated by work (8.5 on a 10- point scale) and feel more useful at work (9.2 on a 10- point scale)
Health Evaders A logical combination of lower perceived overall health with several potentially serious health conditions. Lowest perceived health (4.9 on a 10-point scale) among all of the segments High blood pressure (19%), high cholesterol (35%), a heart condition (12%), diabetes (13%), asthma (11%) arthritis (27%) Nearly half say they are overweight (46%) especially 15kg or more (66%) less satisfied with their jobs More likely to say their job makes them feel older than they are (19%) a Less likely to look forward to going to work (54%) more likely to miss personal family activities (20%) and lose sleep (15%) because of their jobs Less motivated (742 on a 10-point scale) and feel less useful (6.4 on a 10-point scale) at work than other segments
Health Illusionists Despite reported health conditions, Health Illusionists believe they are very healthy overall Among the highest perceived health (7.5 on a 10-point scale) among all of the segments More likely to suffer from arthritis (33%). Also reported high blood pressure (17%) High cholesterol (18%) One in four say they are overweight (41%) especially 5-10KG or more (55%) 68% agree that they look forward to work on most days (more motivated to perform well at work (8.8 on a 10-point scale) and feel more useful at work (8.9 on a 10-point scale)
