What Becoming Data-Driven Every Day Looks Like
Get acquainted with the transformative journey of integrating data into your daily business practices. This blog content ranges from what it means to be truly data-driven, highlighting key components such as leadership commitment, data accessibility,
Download Presentation

Please find below an Image/Link to download the presentation.
The content on the website is provided AS IS for your information and personal use only. It may not be sold, licensed, or shared on other websites without obtaining consent from the author. Download presentation by click this link. If you encounter any issues during the download, it is possible that the publisher has removed the file from their server.
E N D
Presentation Transcript
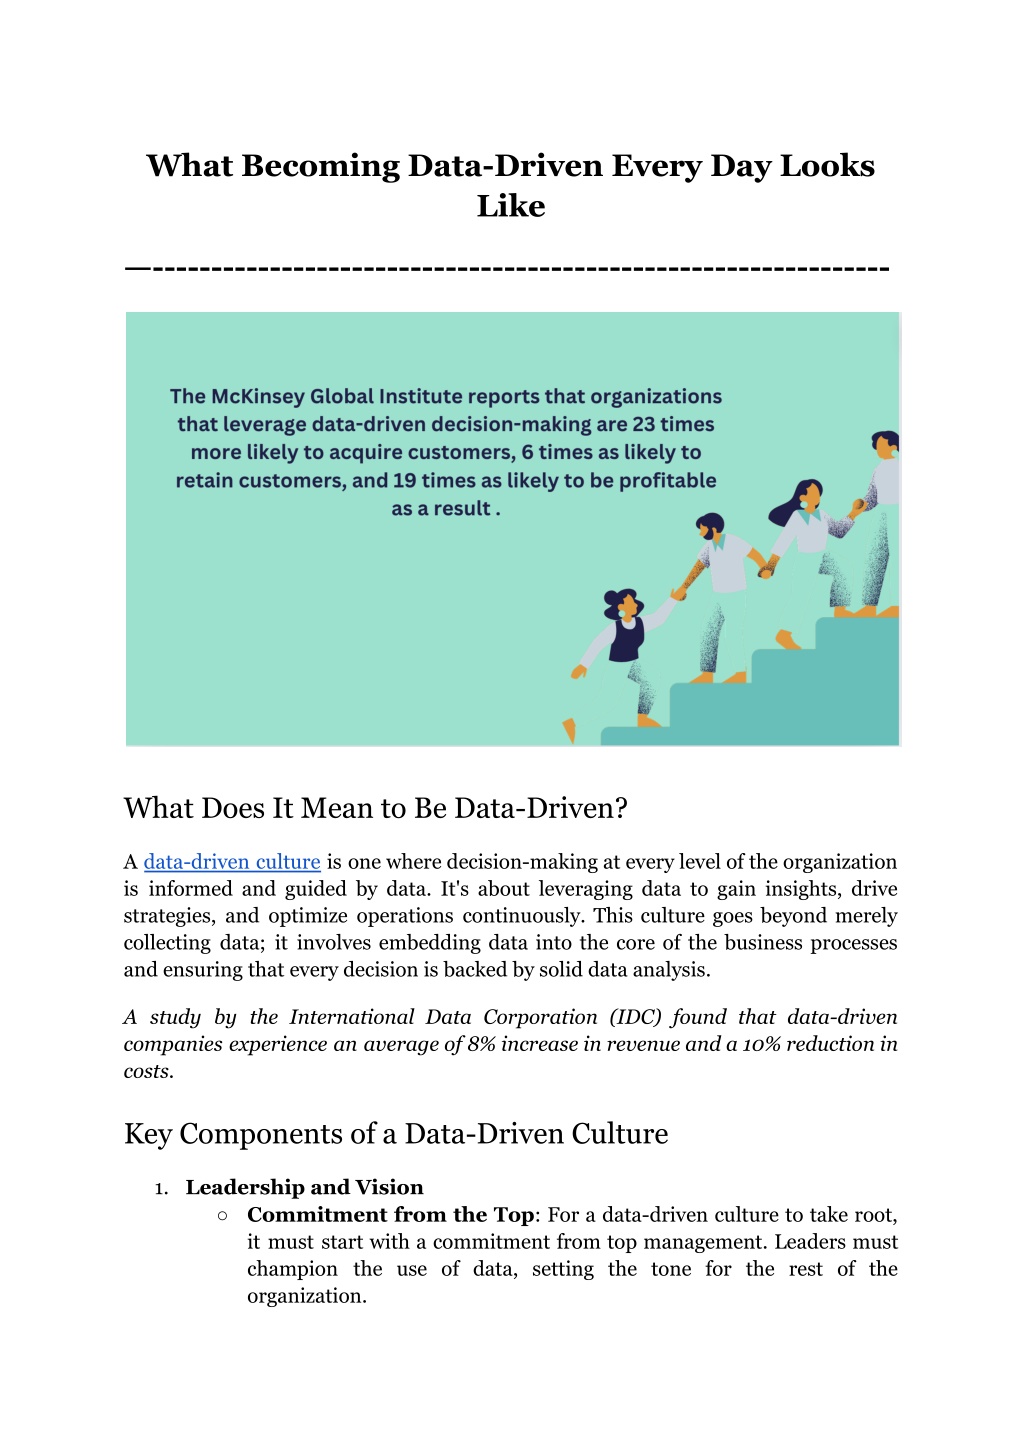
What Becoming Data-Driven Every Day Looks Like --------------------------------------------------------------- What Does It Mean to Be Data-Driven? A data-driven culture is one where decision-making at every level of the organization is informed and guided by data. It's about leveraging data to gain insights, drive strategies, and optimize operations continuously. This culture goes beyond merely collecting data; it involves embedding data into the core of the business processes and ensuring that every decision is backed by solid data analysis. A study by the International Data Corporation (IDC) found that data-driven companies experience an average of 8% increase in revenue and a 10% reduction in costs. Key Components of a Data-Driven Culture 1. Leadership and Vision Commitment from the Top: For a data-driven culture to take root, it must start with a commitment from top management. Leaders must champion the use of data, setting the tone for the rest of the organization.
Learn Why Leadership Loves Grow Clear Vision and Goals: Define clear, data-focused goals and communicate them effectively throughout the organization. This vision should align with the overall business strategy and be supported by measurable objectives. As part of defining clear, data-focused goals, understanding how to set KPIs is crucial for aligning them with the overall business strategy, ensuring they are actionable and measurable. 1. Data Accessibility Democratizing Data: Make data accessible to all employees, not just data scientists or analysts. Tools, like Grow BI dashboards, can democratize data, allowing everyone from executives to frontline staff to access and use data in their daily tasks. Self-Service Analytics: Implement self-service analytics platforms that enable non-technical users to explore data, generate reports, and gain insights without relying on IT departments. Is your team making the most of the data it has access to? With Grow BI's dynamic views and variable management, you can assign tailored data views to each team member, ensuring everyone has access to the insights they need. Easily manage and assign roles with our intuitive interface, as shown above, and empower your sales team with the right data at the right time with our 14-day free demo. 1. Data Literacy and Training Education and Training Programs: Develop comprehensive training programs to enhance data literacy across the organization, specifically on how to set KPI systems and monitor them effectively. 2
Employees should understand how to interpret data, use analytics tools, and apply data insights to their work. Continuous Learning: Encourage an environment where learning and development are ongoing processes. Provide resources and opportunities for employees to stay updated with the latest data analytics trends and technologies. 2. Collaboration and Communication Cross-Functional Teams: collaborate on data projects. perspectives and expertise decision-making. Effective Communication: Establish clear communication channels for sharing data insights and findings. Regularly update teams on key metrics and performance indicators to keep everyone aligned and informed. 3. Technology and Tools Robust BI Tools: Invest in robust business intelligence (BI) tools that facilitate data collection, analysis, and visualization. Grow BI, for example, offers customizable dashboards that provide real-time insights tailored to specific business needs, seamlessly integrating KPI in dashboard displays that offer a clear view of these indicators. Data Integration: Ensure seamless integration of BI tools with existing systems and databases. This integration is critical for maintaining data accuracy and consistency across the organization. Form This are cross-functional approach applied to teams to ensures data diverse and analysis Daily Practices of Data-Driven Companies For UK businesses looking to stay competitive, adopting data-driven practices is essential. Data-driven companies leverage insights to make informed decisions, optimize operations, and drive growth. Let s explore the daily practices of these companies, highlighting how they use data effectively to achieve their goals. Empowering Employees with Data Access Data-driven companies ensure that data is accessible to everyone, not just the data team. This democratization of data fosters a culture where decisions at all levels are informed by data. Implementing user-friendly tools like metrics dashboards allows employees to visualize and interpret data effortlessly. These dashboards consolidate data from various sources, providing a holistic view of the organization s performance. KPI in dashboard features ensure that each team member can monitor specific metrics relevant to their department's objectives, enhancing decision-making precision with added ease. 3
For instance, a sales department might track conversion rates, while the customer service team monitors response times. These KPIs are integrated into the metrics dashboard, offering real-time insights and enabling quick adjustments. Informed Decision-Making Processes In data-driven companies, decisions are always backed by data. This approach minimizes guesswork and increases the likelihood of success. Tools like Grow BI dashboards provide real-time data, enabling managers to make timely and accurate decisions. For example, a marketing manager can use these dashboards to track campaign performance and adjust strategies based on real-time data. Continuous Monitoring and Improvement Real-Time Monitoring Continuous monitoring of performance metrics is a daily practice in data-driven companies. This is tracking KPIs in real-time with a metrics dashboard. KPI in dashboard displays provide a clear picture of current performance, highlighting areas that need attention. For example, a production manager might monitor production efficiency and quality control metrics to ensure smooth operations. Feedback Loops and Adjustments Data-driven companies establish feedback loops to continuously improve their processes. Regular review meetings are held to discuss performance against KPIs and identify areas for improvement. For example, a weekly sales meeting might review the latest metrics dashboard, discussing what worked and what didn t. This iterative approach helps in fine-tuning strategies and achieving better results over time. Leveraging Advanced Analytics Advanced analytics, such as predictive analytics, are used to forecast future trends and outcomes. Data-driven companies leverage these tools to stay ahead of the curve. For instance, using predictive models, a retail company can forecast demand for different products, ensuring optimal inventory levels. These forecasts are integrated into the metrics dashboard, providing actionable insights. Innovation is driven by data in these companies. By analyzing customer feedback, market trends, and performance data, they identify opportunities for new products and services. 4
Examples of smart KPIs for innovation might include the number of new ideas generated, the percentage of ideas implemented, and the impact on revenue growth. These KPIs are tracked in the dashboard to measure the effectiveness of innovation initiatives. Conclusion The road to becoming a data-centric organization is long and winding, so keep that in mind as you go. If you have Grow on your side, you can streamline the process and make sure that everyone on your team has the information they need to make the most of your data. Grow s dynamic views and robust metrics dashboards, complete with KPI in dashboard capabilities, ensure that your team can access and analyze real-time data effortlessly. With features like custom KPI dashboards, you can set and track KPIs tailored to your business goals, providing clear and actionable insights. Grow can help you navigate a better, data-driven future as you embrace the digital revolution. By leveraging examples of SMART KPIs and understanding how to set KPI effectively, your organization can make informed decisions that drive growth and innovation. Have questions or need a personalized demo? Contact us today after going through Grow.com Reviews & Ratings 2024 TrustRadius and learn how Grow can help your business become truly data-driven. 5

