Waterfowl Breeding Population and Habitat Survey Analysis 2016
This analysis presents estimates from the 2016 Waterfowl Breeding Population and Habitat Survey, showcasing population estimates for various waterfowl species over different years. The data includes visual representations of duck populations, number of ponds, and population estimates for species like Mallard, Gadwall, American Wigeon, Green-winged Teal, and more.
Download Presentation

Please find below an Image/Link to download the presentation.
The content on the website is provided AS IS for your information and personal use only. It may not be sold, licensed, or shared on other websites without obtaining consent from the author. Download presentation by click this link. If you encounter any issues during the download, it is possible that the publisher has removed the file from their server.
E N D
Presentation Transcript
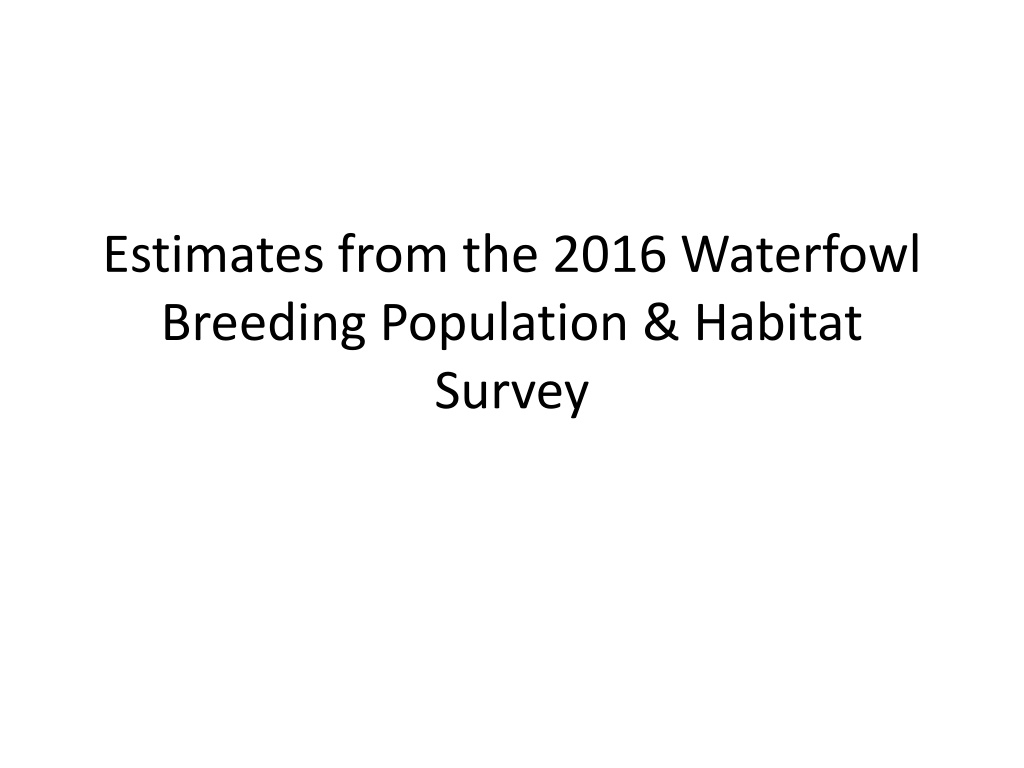
Estimates from the 2016 Waterfowl Breeding Population & Habitat Survey
Total ducks 50 45 Population Estimate (in Millions) 40 35 30 25 1955 1965 1975 1985 1995 2005 2015 Year
9 8 7 Number of Ponds (in Millions) 6 5 Total 4 Prairie Canada 3 2 Northcentral U.S. 1 0 1960 1970 1980 1990 2000 2010 2020 Year
Mallard 12 Population Estimate (in Millions) 10 8 6 4 1955 1965 1975 1985 1995 2005 2015 Year
Gadwall 5 4 Population Estimate (in Millions) 3 2 1 0 1955 1965 1975 1985 1995 2005 2015 Year
American wigeon 5 4 Population Estimate (in Millions) 3 2 1 0 1955 1965 1975 1985 1995 2005 2015 Year
Green-winged teal 5 Population Estimate (in Millions) 4 3 2 1 0 1955 1965 1975 1985 1995 2005 2015 Year
Blue-winged teal 10 Population Estimate (in Millions) 8 6 4 2 0 1955 1965 1975 1985 1995 2005 2015 Year
Northern shoveler 6 5 Population Estimate (in Millions) 4 3 2 1 0 1955 1965 1975 1985 1995 2005 2015 Year
Northern pintail 12 10 Population Estimate (in Millions) 8 6 4 2 0 1955 1965 1975 1985 1995 2005 2015 Year
Redhead 2.0 Population Estimate (in Millions) 1.5 1.0 0.5 0.0 1955 1965 1975 1985 1995 2005 2015 Year
Canvasback 1.5 Population Estimate (in Millions) 1.0 0.5 0.0 1955 1965 1975 1985 1995 2005 2015 Year
Scaup 10 8 Population Estimate (in Millions) 6 4 2 0 1955 1965 1975 1985 1995 2005 2015 Year
Mallard 800 700 Population estimate (in thousands) 600 500 400 300 200 100 1990 1995 2000 2005 2010 2015 2020 Year
American black duck 900 800 Population estimate (in thousands) 700 600 500 400 300 200 100 1990 1995 2000 2005 2010 2015 2020 Year
Green-winged teal 500 Population estimate (in thousands) 400 300 200 100 1990 1995 2000 2005 2010 2015 2020 Year
Ring-necked duck 900 800 Population estimate (in thousands) 700 600 500 400 300 200 100 1990 1995 2000 2005 2010 2015 2020 Year
Goldeneyes 900 800 Population estimate (in thousands) 700 600 500 400 300 200 100 1990 1995 2000 2005 2010 2015 2020 Year
Mergansers 700 600 Population estimate (in thousands) 500 400 300 200 100 1990 1995 2000 2005 2010 2015 2020 Year


