Visual Analysis of North Atlantic Precipitation and Pressure Anomalies
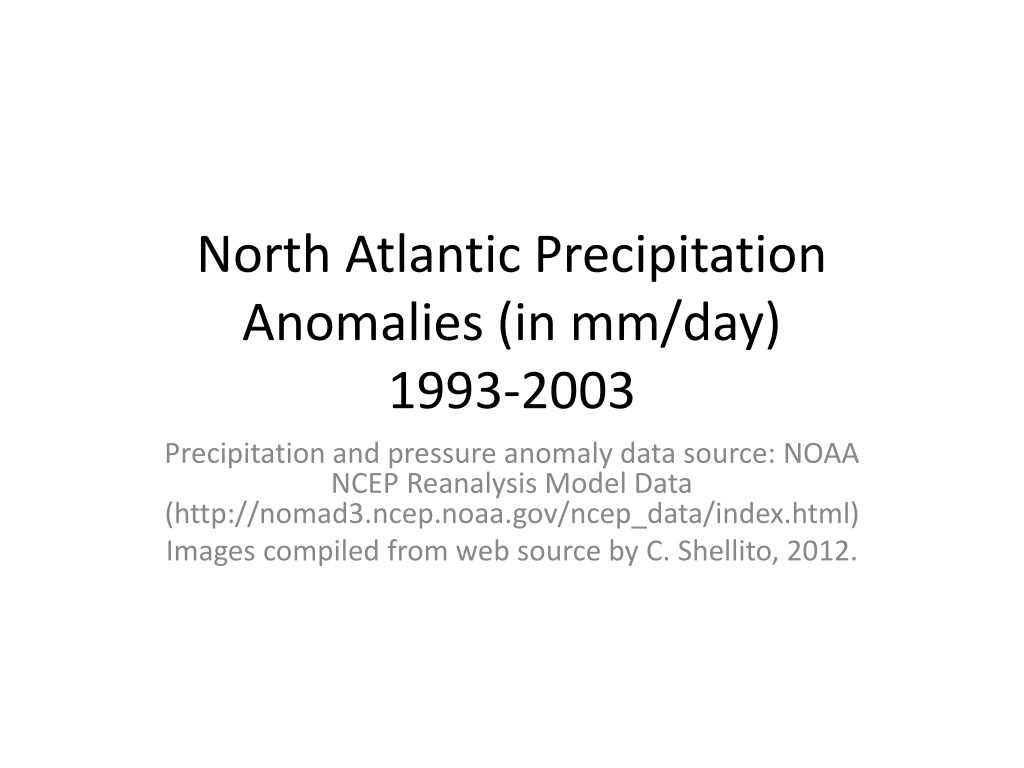
Explore North Atlantic precipitation anomalies and wintertime pressure anomalies data from 1993-2003, sourced from NOAA NCEP Reanalysis Model. The visuals provide insights into the variations in precipitation and pressure in the North Atlantic region during this period.
Download Presentation

Please find below an Image/Link to download the presentation.
The content on the website is provided AS IS for your information and personal use only. It may not be sold, licensed, or shared on other websites without obtaining consent from the author. Download presentation by click this link. If you encounter any issues during the download, it is possible that the publisher has removed the file from their server.
E N D
Presentation Transcript
North Atlantic Precipitation Anomalies (in mm/day) 1993-2003 Precipitation and pressure anomaly data source: NOAA NCEP Reanalysis Model Data (http://nomad3.ncep.noaa.gov/ncep_data/index.html) Images compiled from web source by C. Shellito, 2012.
North Atlantic Wintertime Pressure Anomalies (in mb)







![Comprehensive Case Study on [Insert Case Title Here]](/thumb/159705/comprehensive-case-study-on-insert-case-title-here.jpg)
![[Insert Study Name] Study Webinar: Engaging Participants for Research Progress](/thumb/168084/insert-study-name-study-webinar-engaging-participants-for-research-progress.jpg)


