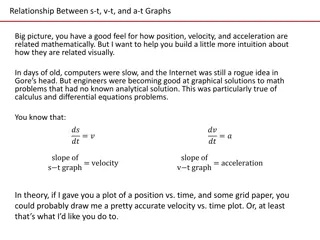
Velocity - time graph(v-t graph)

Velocity - time graph(v-t graph)
Slope of v-t graph
Area under v-t graph

Velocity time graph for a body moving
with constant velocity
As we know the independent quantity is taken
along x axis the dependent quantity is taken
along the y axis. So here in v-t graph time will
be taken on x axis and velocity will be taken
along y axis .
1. When a body is moving with constant velocity
i.e. its motion is uniform. Its velocity does not
change with time.
Than the velocity time
graph is a straight line parallel to time axis.
Continuied
•
We can use velocity – time graph for calculating the displacement of the
body .
•
Magnitude of displacement of the body = area under v-t graph.
Velocity time graph for uniform
motion when initially body is at rest.
•
let us suppose the body is initially is at rest. Then velocity of the body at
t= 0 .after that the velocity of body increases at a constant rate. That is, in
every unit interval of time , the velocity of body increases by an equal
amount. the v-t graph is shown below
•
velocity time graph of a body having uniform motion Is a straight line
passing through the origin and having a constant slope.
Uses of v-t graph for uniform motion
It is used to calculate acceleration and displacement of the body.
1.
Calculation of Acceleration :-
acceleration
= change in velocity / time taken
= AB/ OB
= (
v
2
-v
1
)/
(t
2
-t
1
)
=
△v/ △t
2.
Calculation of magnitude of displacement :-
Magnitude of displacement =
area under v-t graph
=
area under OA = area of
△OAB
= ½ x base x height
= ½ x OB x AB = ½
x (v
2
-v
1
)x(t
2
-t
1
)
continued
•
v-t graph for uniform motion when initially body is not at rest
is shown in the following fig.
Velocity time graph when the velocity of
the body is decreases uniformly to zero
Let us suppose the body is initially moving with a certain
velocity at t=0. let there after , the velocity of the body
decreases uniformly an ultimately becomes zero after
some time. Then the v-t graph is given below
Velocity - time graph, when the
velocity of an object is not uniform
When the velocity of an object changes non uniformly
i.e., change in velocity is not equal in equal interval of
time then the v-t graph is as follows
Home work
•
Name the physical quantity measured by the area under velocity time graph.
•
Name the quantity measured by slope of v-t graph for uniform motion.
•
Name a physical quantity which remains constant during uniform circular
motion.
•
Draw v-t graph for the following data and answer the given questions.
1. find the acceleration?
2. find the displacement of the body ?
3. what you can say about the nature of motion?
•
What type of motion , an object have if its v-t graph is a straight line parallel
to time axis, a straight line passing through origin and having constant slope.
How velocity-time graphs represent motion, calculate acceleration and displacement, and analyze different scenarios of uniform and non-uniform motion using the slope and area under the graph.

Download Presentation

Please find below an Image/Link to download the presentation.
The content on the website is provided AS IS for your information and personal use only. It may not be sold, licensed, or shared on other websites without obtaining consent from the author.If you encounter any issues during the download, it is possible that the publisher has removed the file from their server.
You are allowed to download the files provided on this website for personal or commercial use, subject to the condition that they are used lawfully. All files are the property of their respective owners.
The content on the website is provided AS IS for your information and personal use only. It may not be sold, licensed, or shared on other websites without obtaining consent from the author.
E N D
Presentation Transcript
Velocity - time graph(v-t graph) Slope of v-t graph Area under v-t graph
Velocity time graph for a body moving with constant velocity As we know the independent quantity is taken along x axis the dependent quantity is taken along the y axis. So here in v-t graph time will be taken on x axis and velocity will be taken along y axis . 1. When a body is moving with constant velocity i.e. its motion is uniform. Its velocity does not change with time. Than the velocity time graph is a straight line parallel to time axis.
Continuied We can use velocity time graph for calculating the displacement of the body . Magnitude of displacement of the body = area under v-t graph.
Velocity time graph for uniform motion when initially body is at rest. let us suppose the body is initially is at rest. Then velocity of the body at t= 0 .after that the velocity of body increases at a constant rate. That is, in every unit interval of time , the velocity of body increases by an equal amount. the v-t graph is shown below velocity time graph of a body having uniform motion Is a straight line passing through the origin and having a constant slope.
Uses of v-t graph for uniform motion It is used to calculate acceleration and displacement of the body. 1. Calculation of Acceleration :- acceleration = change in velocity / time taken = AB/ OB = (v2-v1 )/ (t2-t1)= v/ t 2. Calculation of magnitude of displacement :- Magnitude of displacement = area under v-t graph = area under OA = area of OAB = x base x height = x OB x AB = x (v2-v1 )x(t2-t1)
continued v-t graph for uniform motion when initially body is not at rest is shown in the following fig.
Velocity time graph when the velocity of the body is decreases uniformly to zero Let us suppose the body is initially moving with a certain velocity at t=0. let there after , the velocity of the body decreases uniformly an ultimately becomes zero after some time. Then the v-t graph is given below
Velocity - time graph, when the velocity of an object is not uniform When the velocity of an object changes non uniformly i.e., change in velocity is not equal in equal interval of time then the v-t graph is as follows
Home work Name the physical quantity measured by the area under velocity time graph. Name the quantity measured by slope of v-t graph for uniform motion. Name a physical quantity which remains constant during uniform circular motion. Draw v-t graph for the following data and answer the given questions. Time (s) 0 2 4 6 8 Velocity (m/s) 5 10 15 20 25 1. find the acceleration? 2. find the displacement of the body ? 3. what you can say about the nature of motion? What type of motion , an object have if its v-t graph is a straight line parallel to time axis, a straight line passing through origin and having constant slope.
")