Measurement of Flow Velocity on Frozen and Non-Frozen Slopes of Black Soil Using Leading Edge Method
This study presented a detailed methodology for measuring flow velocity on frozen and non-frozen slopes of black soil, focusing on the Leading Edge method. The significance of shallow water flow velocity in soil erosion processes was emphasized. Various methods for measuring flow velocity were compared, with a specific emphasis on the Electrolyte Tracer method. The challenges and advantages of different techniques, such as the Dye Trace method, were discussed. The Leading Edge method was highlighted as providing accurate velocity measurements, especially when corrected using appropriate techniques.
Download Presentation

Please find below an Image/Link to download the presentation.
The content on the website is provided AS IS for your information and personal use only. It may not be sold, licensed, or shared on other websites without obtaining consent from the author.If you encounter any issues during the download, it is possible that the publisher has removed the file from their server.
You are allowed to download the files provided on this website for personal or commercial use, subject to the condition that they are used lawfully. All files are the property of their respective owners.
The content on the website is provided AS IS for your information and personal use only. It may not be sold, licensed, or shared on other websites without obtaining consent from the author.
E N D
Presentation Transcript
WASWAC 2016 conference Measuring flow velocity on frozen and non-frozen slopes of black soil through leading edge method Chen Chao, Ban Yunyun,Wang Xuefeng, Lei Tingwu China Agricultural University, Beijing, China 2016-8-25
Content Introduction Significance of shallow water flow velocity Methods measure shallow water flow velocity Electrolyte tracer method Methodology Leading edge method Experimental Materials and Methods Results and Discussion Leading edge method measure the velocity of shallow water over frozen and non-frozen slope, and the comparison Effects of slope length on leading edge velocity Correction of velocity measured with leading edge method Coefficients to correct measured velocities by leading edge method Conclusion
Significance of shallow water flow velocity Shallow water flow velocity is a significant parameter soil erosion hydraulic process Flow velocity of shallow water in soil erosion particle detachment sediment transportation sediment deposition
Methods measure shallow water flow velocity Trace method Trace materials researchers limit floating objects Dunkerley et al., 2003 too big for shallow flow water Olivier et al., 2005 Lei et. al., 2005 Katz et al., 1995 Zhang et al., 2010 salt correction coefficient uncertain dyes diffuse and disperse, error Other methods Infrared thermography (Jo o et al. (2014)) large-scale particle image velocimetry (LSPIV)(Creutin et al. (2002) and Fujita et al. (2002))
Dye trace method Dye has long been used Difficult to measure velocity accurately impact of diffusion and dispersion dark-colored soil error measured time by stopwatch short distance produces high relative error
Electrolyte tracer method The method can measure velocity accurately without calibration required
Methodology Leading edge method Leading edge flow velocity was measured with a stopwatch to measure the time for water flow to cover the whole rill length = / V L t well-defined distance reduce measurement error Longer distance reduce relative error of measurement of time Leading edge velocity need to be corrected with accurate velocity, such as the one method with electrolyte trace method
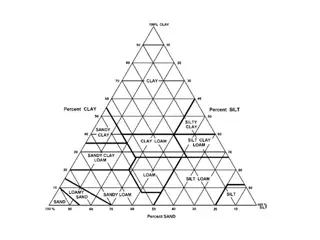
Experimental Materials and Methods Soil: black soil , 49.7% sand, 33.6% silt, and 16.7% clay particles Flumes: 3 m long, 10 cm wide and 12 cm deep Freezer: temperature between 0 C and 20 C Pump: flow rate of 1 L/min to 60 L/min Experiment design water temperature 0 C flow rate 1 2 4 L/min slope gradient 5 10 15 20 slope length 2 4 6 m treatment Frozen and non-frozen soil
Result and Discussion Velocity measured with Leading edge method over frozen slope Flow rate and slope gradient are the key factor affect flow velocity Over frozen slope, leading edge velocity increase with flow rate Over frozen slope, leading edge velocity increase with slope gradient
Velocity measured with Leading edge method over non-frozen slope Over non-frozen slope, leading edge velocity increase with flow rate Over non-frozen slope, leading edge velocity increase with slope gradient until to 15 degree. The leading edge velocity stop to increase from 15 degree
Velocity measured with Leading edge method over non-frozen slope 15 velocity stop increase Headcut Headcuts appear on non-frozen soil Head cuts friction force kinetic energies gravitational potential
Comparison of leading edge velocities over frozen and non-frozen slope 100 velocity over frozen slope (cm/s) 80 60 40 ------ 1 L/min y=1.39x ------ 2 L/min y=1.59x 20 ------ 4 L/min y=1.79x 0 0 20 40 60 80 100 velocity over non-frozen slope (cm/s) leading edge velocity of different slope The leading edge velocities over frozen slope were bigger than that over non-frozen slope With increase of slope gradient and flow rate, the ratio velocity over frozen slope to non-frozen slope increased In figure 2, that is represent that the velocity stop increase at 15 over non-frozen slope, meanwhile the velocity over frozen slope increase fast. leading edge velocity of different flow rates
Comparison of leading edge velocities on frozen and non-frozen slope Causes for the difference surface conditions (friction force ) head cuts reduce velocity more sediments in non-frozen rill to reduce velocity
Effects of slope length on leading edge velocity Table 1 Leading edge velocity at different slope length over frozen soil slopes Slope ( ) Flow rate (L/min) Slope length (m) 2 4 6 1 2 4 1 2 4 1 2 4 1 2 4 18.54 26.5 32.65 23.54 35.34 57.85 31.95 40.23 58.57 33.94 43.5 66.17 18.13 27.47 33.7 23.7 30.43 59.72 33.86 41.53 67.06 36.02 47.17 70.08 18.01 27.94 33.83 24.08 37.93 60.82 36.06 45.27 70.98 37.49 54.98 78.25 5 At low slope, slope length have no significant effect on measured velocity 10 15 At deep slope, the longer slope length, the accelerate effect have a greater effect on velocity 20
Effects of slope length on leading edge velocity Table 2 Leading edge velocity at different slope length over non-frozen slopes Slope ( ) Flow rate (L/min) Slope length (m) 2 17.78 19.6 30.78 21.4 27.45 37.94 27.95 37.11 43.59 29.85 39.34 48.38 4 6 1 2 4 1 2 4 1 2 4 1 2 4 16.51 18.6 28.27 19.49 29.81 37.37 26.59 32.17 42.28 26.84 33.58 42.74 16.99 20.68 27.6 18.38 27.21 35.12 24.24 29.91 38.49 25.26 30.73 38.76 At low slope, slope length have no significant effect on velocity 5 10 on non-frozen slope, longer slope covers more head cuts to produce lower velocity 15 20
Correction of velocity measured with leading edge method on frozen slope 80 Leading edge velocity(cm/s) 80 Leading edge velocity (vm/s) 60 60 ------ 5 y=1.25x 40 40 ------ 1 L/min y=1.18x ------ 2 L/min y=1.23x ------ 4 L/min y=1.23x ------ 10 y=1.28x 20 ------ 15 y=1.23x 20 ------ 20 y=1.19x 0 0 0 20 Accurate velocity(cm/s) 40 60 80 0 20 40 60 80 Accurate velocity(cm/s) Flow velocity over frozen slope under different flow rates Flow velocity over frozen slope under different slope gradients The leading edge velocities were higher than the accurate velocities on frozen slope Leading edge velocity are proportional to the accurate velocity Leading edge velocity can be verified
Correction of velocity measured with leading edge method over non-frozen slope Flow velocity over non-frozen soil under different slope gradients Flow velocity over non-frozen soil under different flow rates Over non-frozen slope, leading edge velocity were higher than accurate velocity Over non-frozen slope, Leading edge velocity are also proportional to the accurate velocity
Coefficients to correct measured velocities by leading edge method 100 100 Accurate velocity(cm/s) 80 Accurate velocity(cm/s) 80 60 60 40 ------ 1L/min y=0.86x 40 ------ 5 y=0.79x ------ 10 y=0.78x ------ 15 y=0.81x ------ 20 y=0.84x ------ 2 L/min y=0.81x 20 20 ------ 4 L/min y=0.81x 0 0 0 20 40 60 80 100 Leading edge velocity(cm/s) 0 20 40 60 80 100 Leading edge velocity(cm/s) Coefficient over frozen soil of different flow rate Coefficient over frozen soil of different slope gradients
Coefficients to correct measured velocities by leading edge method 50 50 Accurate velcity(cm/s) Accurate velocity(cm/s) 40 40 30 30 20 ------ 5 y=0.75x ------ 10 y=0.79x ------ 15 y=0.79x ------ 20 y=0.81x 20 ------ 1 L/min y=0.77x ------ 2 L/min y=0.79x ------ 4 L/min y=0.80x 10 10 0 0 0 10 20 30 40 50 0 10 20 30 40 50 Leading edge velocity(cm/s) Leading edge velocity(cm/s) Coefficient over non-frozen slope under different slope gradients Coefficient over non-frozen slope under different flow rates
Coefficients to correct measured velocities by leading edge method 80 40 Leading edge velocity(cm/s) Accurate velocity(cm/s) y = 0.79x R = 0.97 60 30 y = 0.81x R = 0.98 40 20 20 10 0 0 0 20 Accurate velocity(cm/s) 40 60 80 0 10 20 30 40 Leading edge velocity(cm/s) Coefficient over non-frozen slope Coefficient over frozen slope Non-frozen slope , C=0.79 Frozen slope, C=0.81
Coefficients to correct measured velocities by leading edge method 40 80 y = 1.0047x R = 0.9982 y = 1.0027x R = 0.9984 30 60 Accurate velocity Accurate velocity 20 40 10 20 0 0 0 10 C*leading edge velocity 20 30 40 0 20 C*leading edge velocity 40 60 80 Non-frozen slope Frozen slope Accurate velocity VS C*Leading edge velocity
Conclusion The flow velocities increased with slope gradient and flow rate The velocities achieved a peak value at the slope gradient of 15 over non- frozen slopes At higher slope, velocity over frozen slope increase with slope length increase, while over non-frozen slope, velocity decrease with slope length increase At a slope length of 6 m, the coefficients on frozen slope and non-frozen slope were 0.81 and 0.79 With leading edge method, we can get accurate velocity convenient multiply by coefficient ??= ? ??
