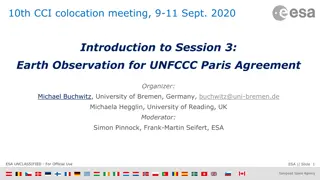
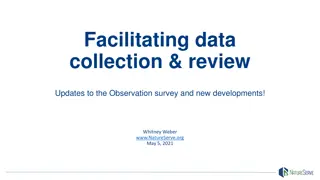
Utilizing Google Earth Engine for Earth Observation Training in Oklahoma
Explore how Google Earth Engine is being used in Oklahoma for ground-based radar and Sentinel backscatter research, with a focus on training undergraduate students in remote sensing. Discover the learning outcomes, student backgrounds, course content, and goals aimed at enhancing data manipulation skills, overcoming programming challenges, and fostering an appreciation for open data.

Download Presentation

Please find below an Image/Link to download the presentation.
The content on the website is provided AS IS for your information and personal use only. It may not be sold, licensed, or shared on other websites without obtaining consent from the author.If you encounter any issues during the download, it is possible that the publisher has removed the file from their server.
You are allowed to download the files provided on this website for personal or commercial use, subject to the condition that they are used lawfully. All files are the property of their respective owners.
The content on the website is provided AS IS for your information and personal use only. It may not be sold, licensed, or shared on other websites without obtaining consent from the author.
E N D
Presentation Transcript
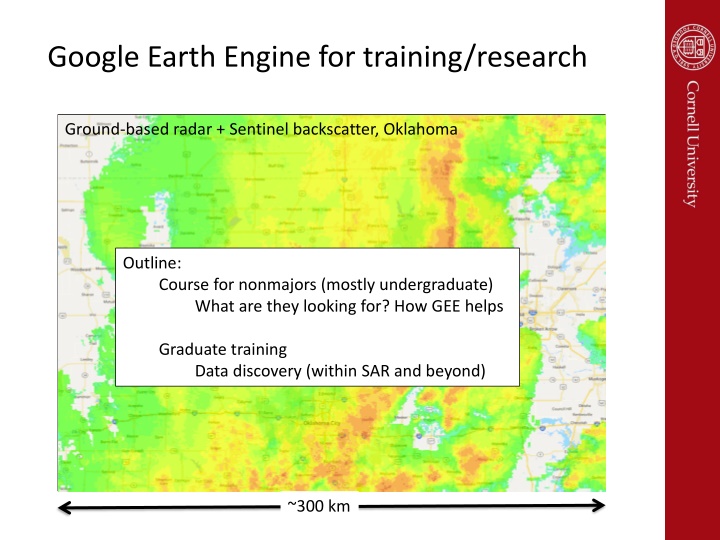
Google Earth Engine for training/research Ground-based radar + Sentinel backscatter, Oklahoma Outline: Course for nonmajors (mostly undergraduate) What are they looking for? How GEE helps Graduate training Data discovery (within SAR and beyond) ~300 km
Learning outcomes By the end of this talk, you will be able to: Describe the range of backgrounds of the students in my remote sensing class for nonmajors Understand some of the strengths and weaknesses of Google Earth Engine when used in teaching Assess whether my graduate students should really be spending their time in GEE Form an opinion about my ability to write learning outcomes
Observing the Earth Remote sensing and GIS Currently in third year, first year using GEE Constituents: Mostly non-majors Between 20 and 50 students 20% with strong programming skills 20% very intimidated by programming/computers Spectrum in between
What we cover Data types raster vs. vector, image formats Key concepts in geodesy, projections Electromagnetic spectrum Imaging basics Orbit, antenna resolution equations History of space observation Where are satellites, how much $, risks Science applications from surface to ionosphere
Course surveys interests? Buzzwords GIS - remote sensing - cloud CV-building Drones? Can we do drones too? Tools crops/soils, regional and urban planning Generally interested in real GIS tools Very interested in use of drones Genuine concern/interest about the Earth Climate change, anthropogenic signals, hazards
MY goals Get the students to look at and manipulate real data Contend with math and computer phobia Algorithms, doing something once, then doing many times Highlight tools that they can potentially use in the future Develop appreciation (and support) for free and open data (and tools)
Development over time First years Introduced students to Matlab and Google Earth Strengths Can do nearly any type of analysis Slope maps/NDVI/pixel-tracking on glaciers Many NASA data products kml/kmz Weaknesses Installation Downloading data (particularly for students on library desktops) Some students bored silly, others completely lost
This year Google Earth Engine Benefits NONE of the students have used it (even playing field) Links to scripts (for help from instructor) Data is right there no downloading Lots of time series tools Students love that they can just zoom around and repeat analyses all over the world Weaknesses Language is still awkward for new users Challenging to debug Profiles? Why is it so hard to make a profile???? Not easy to make a nice figure of what is on the screen
Available datasets So many- Sentinel 1-3, DEMs, Landsat, MODIS, population grids Homework 20 students given free rein, worked with 16 different data types
Visualization Non-majors (and majors) are challenged by thinking beyond rgb GEE allows for quick cycling through of colormaps, band ratios, etc. Lawn laser example
Brightness -> just a number (0-1, 0-255, 0-N) Color = interpretation
Classroom exercise which is which? blue red green
Exercises so far Sorting data (cloud cover, season, location) Band math (NDVI, other combos) Time series (NDVI, night lights, population) Averages over regions Counting (population within a contour of shaking intensity for recent earthquakes) Fun comparing SAR dual-pol with NDVI, letting students find band combos that emphasize contrast in agricultural areas.
Undergrad take-homes My main challenge making exercises that are interesting but not too difficult SAR we talk about resolution, but they don t focus anything themselves Goal understand capability, potential pitfalls Example RF interference (potential political issue)
Graduate research Solid Earth deformation In past, mostly focused on phase only Take-home points Data discovery, evaluation of time series depth, amplitude effects Combination with other data types Weather models, ground-based radar, land use change, Landsat, etc. Bringing in own data (geotiffs)
Soil moisture in arid/hyperarid regions Before After Example: Unusual storm in Saudi Arabia in May, 2018 lakes in between sand dunes
Soil moisture in arid/hyperarid regions Coherence time series at a point Drying out Blue = rain, Yellow = dry Rain Coherence more stable than amplitude, but has sign ambiguity
Why do they make the boats stay in boxes????
Oklahoma example: Ground-based radar brought in as geotiff to personal assets area
Red = lighter than average, blue = darkening No change here
Brightening mostly in fields that are bare according to NDVI (Landsat)
At storm front brightening and darkening, not correlated with surface
Other applications Examining contribution to inferred displacement time series in areas with logging (Cascadia) Challenges in separating vegetation term from soil moisture term Combine Landsat-based LC datasets with precipitation/weather models GEE internal spatial filters work well for actual analysis
Take home points GEE very effective tool for some sorts of teaching, intercomparison of datasets Fast, with access to incomprehensible amounts of data Not very useful for making effective final figures, but can output products to geotiff


")
")