Using Data Effectively
Utilizing data effectively is crucial for ensuring food security during crises. This content delves into examples from Sierra Leone and Guatemala, showcasing the importance of gathering and analyzing the right data for decision-making in food assistance programs. From qualitative interviews on cell phone coverage to quantitative data on households and poverty indicators, these case studies highlight the necessity of evidence-based decision-making in ensuring efficient aid distribution during emergencies.

Download Presentation

Please find below an Image/Link to download the presentation.
The content on the website is provided AS IS for your information and personal use only. It may not be sold, licensed, or shared on other websites without obtaining consent from the author.If you encounter any issues during the download, it is possible that the publisher has removed the file from their server.
You are allowed to download the files provided on this website for personal or commercial use, subject to the condition that they are used lawfully. All files are the property of their respective owners.
The content on the website is provided AS IS for your information and personal use only. It may not be sold, licensed, or shared on other websites without obtaining consent from the author.
E N D
Presentation Transcript
Every day. In times of crisis. For our future. Using Data Effectively Challenges and Successes on Food for Peace Programs
Every day. In times of crisis. For our future. Getting the right data for decisions Sierra Leone Example
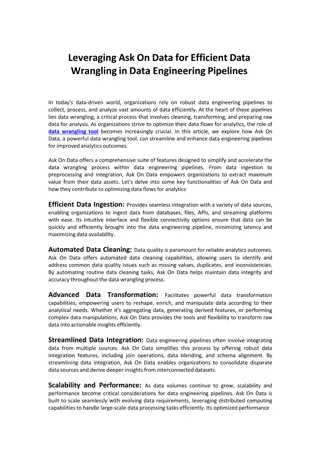
Getting the right data for decisions Qualitative key informant interviews indicated: Cell phone coverage of the Kailahun district in Sierra Leone Access to cell phone credit and mobile providers is available in all chiefdoms in district 3
Getting the right data for decisions Quantitative data collected in surveys at registration for validation: Cash Transfer Mobile Accessibility and Comfort with Mobile Money Total households in census for registration Households with their own mobile phone Households with phones that have reliable network Households with network covered phones who are comfortable with mobile transfers Geographic Chiefdom Dea Jaluahun Jawei Kissi Kama Kissi Teng Kpeje Bongre Luawa Malema Upper_bambara Missing data Grand Total Grand Total Yes 13 109 38 % Yes 4 61 10 2 47 11 41 3 9 % Yes % 276 1003 975 311 660 354 1654 635 710 5% 11% 4% 2% 10% 4% 5% 2% 3% 31% 56% 26% 40% 70% 73% 47% 21% 43% 1 25% 25% 10% 100% 62% 36% 41% 100% 56% 15 1 2 5 67 15 87 14 21 29 4 17 3 5 33 6611 369 6% 188 51% 77 41% 4
Every day. In times of crisis. For our future. Making evidence based decisions Guatemala Example
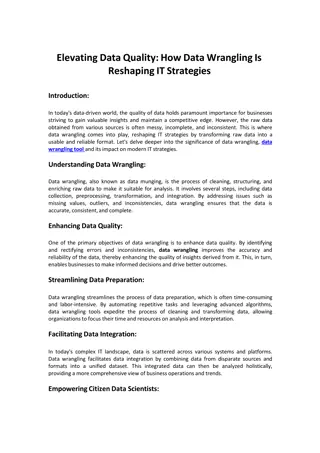
Making evidence based decisions Prioritizing the activities and populations based on poverty # Indicator How many household members are aged 13 or younger? Possible Response Points 1 A. B. C. D. E. F. A. B. C. A. B. C. A. B. A. B. C. D. A. B. A. B. A. B. A. B. A. B. C. Five or more Four Three Two One None No No children ages 7 to 13 Yes No Yes No female head/spouse Yes No Earth, sand, wood, or other Mud bricks or cement slab Formed cement bricks Parquet, granite or ceramic No Yes No Yes Yes No No Yes No Yes No one works mainly in agriculture A. B. C. D. E. F. A. B. C. A. B. C. A. B. A. B. C. D. A. B. A. B. A. B. A. B. A. B. C. 0 10 12 17 23 33 0 2 6 0 6 9 0 5 0 3 9 15 0 9 0 8 0 3 0 8 0 3 4 Did all children ages 7 to 13 enroll for the current school year? 2 Can the female head/spouse read and write? 3 Do any household members work mainly as casual laborers or domestic workers? 4 What is the main construction material of the residence s floors? 5 Does the household have a refrigerator? 6 Does the household have a gas or electric stove? 7 Does the household have a stone mill? 8 Does the household have an electric iron? 9 If any household member works mainly in agriculture, animal husbandry, hunting, or fishing, does the household have any cows, bulls, calves, pigs, horses, burros, or mules? 10 6
Making evidence based decisions Prioritizing the activities and populations based on poverty Cutoff Points Probability of being below the poverty lines of Guatemala Classification Extremely poor Poor Non-poor 19 or less 20 to 39 40 or more 74.5% 70.3% "Extreme" USAID Poverty Line National Poverty Line Average PPI scores per region Quich : Huehuetenango: Quetzaltenango: Total: 23.42 30.07 34.56 28.05 7
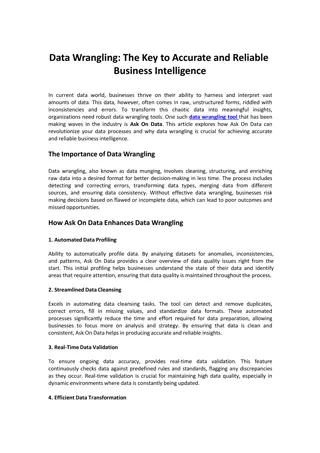
Making evidence based decisions Implementation changes No more enrollment in food or cash transfers with those households with a PPI score of 40 or more. Households could, however, continue to attend growth monitoring and promotion sessions, trainings on disaster risk reduction in their communities, and sustainable livelihood promotion trainings and demonstrations. In FY2017, differentiated enrollment in PAISANO activities based on PPI scores and livelihood activities were set. Of 100 new potential beneficiaries identified, who participated in small producer groups, PPI scores revealed the likelihood that 7% were extremely poor, 72% poor and 21% not poor. This stratification helped to determine the different categories and the type of support that each household should receive. Of 977 new potential beneficiaries identified as pregnant or with infant children, only 6% were classified as Not Poor and were told that they were not eligible to receive cash transfers as an incentive for participation in PAISANO. The cases identified as poor or extremely poor were 75% and 19% respectively. 8
Every day. In times of crisis. For our future. Data challenges in gauging quality of interventions for expected impacts Multiple Country Examples
Gauging quality of interventions for expected impacts- The Missing Middle FFP baseline and endline indicators are population based and typically budgeted to be collected at the beginning and end of the program. If the team is only using FFP annual monitoring indicators to track progress on the Theory of Change, it is possible that they might only capture those trained and adopting practices or changing behaviors. There is a need to make sure in the Annual Reviews of the Theory of Change, whether the programs have sufficient evidence to assess whether: 1. Are new practices or behaviors leading to reductions in stunting or improved incomes as expected? 2. Do we have a real sense of the spillover effects? 3. Are monitoring and evaluation activities well designed to reflect on the extent the program is moving the needle? 10