University SGR Funds Distribution Model
The University State General Revenue Funds (tuition + state $$) distribution model for University Colleges based on student credit hours and specific earmark programs. It outlines the principles of the eRVU model, education activity models, and equal weight allocation for different teaching categories. The model emphasizes fair distribution based on factors like student enrollment, faculty effort, and program support.
Download Presentation

Please find below an Image/Link to download the presentation.
The content on the website is provided AS IS for your information and personal use only. It may not be sold, licensed, or shared on other websites without obtaining consent from the author.If you encounter any issues during the download, it is possible that the publisher has removed the file from their server.
You are allowed to download the files provided on this website for personal or commercial use, subject to the condition that they are used lawfully. All files are the property of their respective owners.
The content on the website is provided AS IS for your information and personal use only. It may not be sold, licensed, or shared on other websites without obtaining consent from the author.
E N D
Presentation Transcript
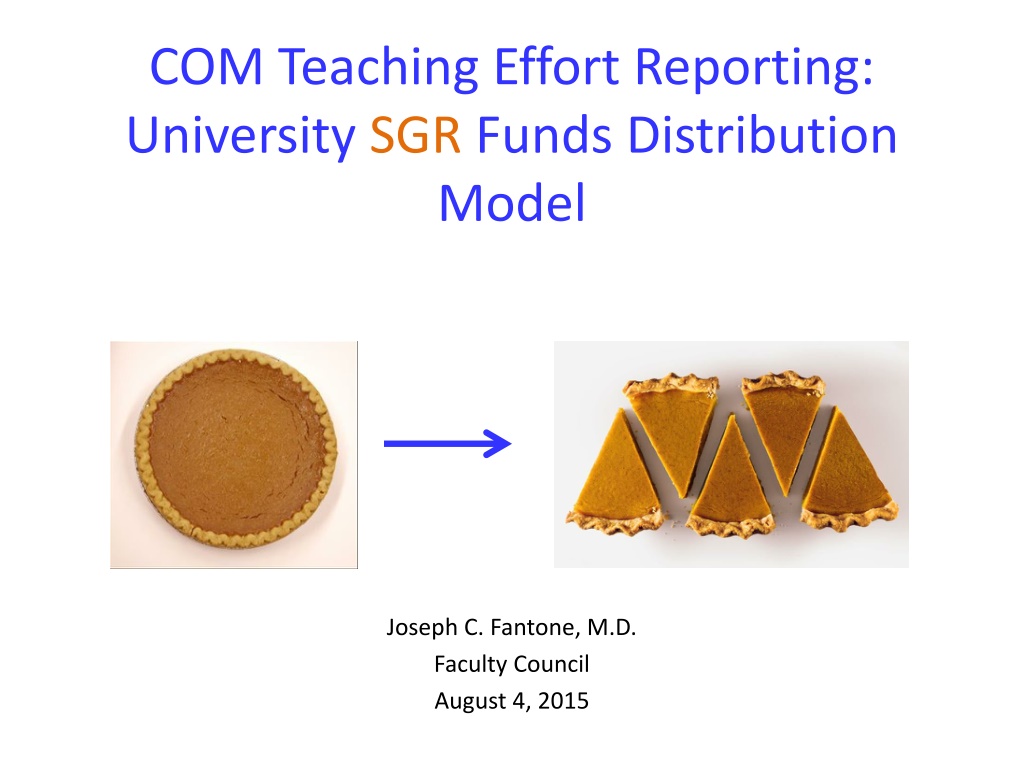
COM Teaching Effort Reporting: University SGR Funds Distribution Model Joseph C. Fantone, M.D. Faculty Council August 4, 2015
State General Revenue (tuition + state $$) University Colleges* * Based on student credit hours (SCH) and some earmark programs University tax: RCM = ~ 42% Specific earmark programs Dean Admin.: Med Ed, Grad. + MD/PhD (includes stipends and tuition), PA programs, Faculty Education FTE supported by Dean SGR to Depts. based on proportion of total eRVUs Basic Science Clinical
Principles of eRVU Model: Modified Previous Model Funds allocation model not IWL Faculty teaching only COM courses teaching only: Med. + Grad. + PA + Undergrad Includes basic science Dental Courses All teaching given equal weight independent of learner (e.g. undergrad. vs. medical) or teacher (e.g. rank or specialty) Does not include residents, post-doctoral fellows, CME Includes only admissions committee work (Med. and Grad.) Clerkships based on student enrollment (student weeks) due to variability in reporting and programs 2011-12: effort assignments reviewed by course/clerkship directors, concentration directors and Curriculum Committee
Education Activity New Model Lecture /Small Group /Lab 3 eRVU/contact hr. Required Clerkship 10 eRVU/ student week* Elective Clerkship 5 eRVU/ student week: GNV Undergrad shadowing in course 0.25 eRVU/ student half day Module/course directors, discipline coordinators Collaborative Learning Group (CLG) Faculty Facilitators 0.05-0.5FTE 0.1 FTE Required med clerkship directors 0.4 FTE Concentration Directors IDP 0.12 FTE (shared) Report hours = eRVUs (adjust if receive direct support) 4 eRVUs/week Course directors (non-med student) Grad student in lab Undergrad research: BMS 4905 2 eRVUs/week *VA/JAX/other = 3 eRVU/student week 4
Education Activity New Model Phase 1 Preceptorships 10eRVUs/wk MSRP 4 eRVUs/ wk Journal clubs 3 eRVUs per 1 faculty per 1 contact hour Dissertation Committee Included as part of 4 eRVUs/week Clerkship coordinators Dept. support Dept. support except med. interdisciplinary courses centrally supported by OME Course coordinators Admissions committee (MD) 3 eRVUs/interview Admissions committee (IDP) 3 eRVUs/interview 5
All Teaching Equal Weight: RCM Funds Generation Revenue -COM student & COM course credit hours Student weight rate (2011) MD-resident 34.29 688.1 40 $ 88,088 MD- non-resident 34.29 1384.29 40 $ 97,282 PHD resident 16.02 388.52 24 $ 25,223 PhD non-resident 16.02 1078.73 24 $ 30,690 PA resident 9.1 388.52 40 $ 26,095 PA non-resident 9.1 1182.26 40 $ 36,573 Masters resident 9.1 388.52 24 $ 15,656 Masters non-resident 9.1 1072 24 $ 21,072 undergrad- resident 8.87 95.67 4 $ 2,170
All Teaching Equal Weight: RCM Funds Generation 2011 (Approximate: Based on 2011) Revenue - COM student & COM course * sub- total revenue: Post RCM Tax Net revenue% of Total weight rate (2011)credit # Student hours students Revenue MD-resident 34.29 688.1 40 $88,088 530 $28,011,984 $28,595,676 81.67% MD- non-resident 34.29 1384.29 40 $97,282 10 $583,692 PHD resident 16.02 388.52 24 $25,223 150 $2,270,070 9.11% PhD non-resident 16.02 1078.73 24 $30,690 50 $920,700 $3,190,770 PA resident 9.1 388.52 40 $26,095 100 $1,565,700 5.73% PA non-resident 9.1 1182.26 40 $36,573 20 $438,876 $2,004,576 Masters resident 9.1 388.52 24 $15,656 10 $93,936 0.63% Masters non-resident 9.1 1072 24 $21,072 10 $126,432 $220,368 (non COM student = $1519) 2.86% undergrad- resident 8.87 95.67 4 1100 $ 1,002,540 $1,002,540 Total $35,013,930 * RCM Taxes = ~40%
