Understanding VR Performance Indicators and WIOA Compliance
Develop a deeper understanding of the performance indicators required under WIOA, exploring federal compliance versus agency choice, strategies for measuring employee performance, and adapting VR practices to meet WIOA expectations. Review New Jersey CBVI strategies for follow-up services and tracking, and learn about the goals, vision, and data evaluation required for VR leadership and program improvement. Explore areas for enhancement in NJCBVI programs such as quality assurance, supervision, and reporting requirements. Dive into the VR regulations governing program foundation and individual support.
Download Presentation

Please find below an Image/Link to download the presentation.
The content on the website is provided AS IS for your information and personal use only. It may not be sold, licensed, or shared on other websites without obtaining consent from the author. Download presentation by click this link. If you encounter any issues during the download, it is possible that the publisher has removed the file from their server.
E N D
Presentation Transcript
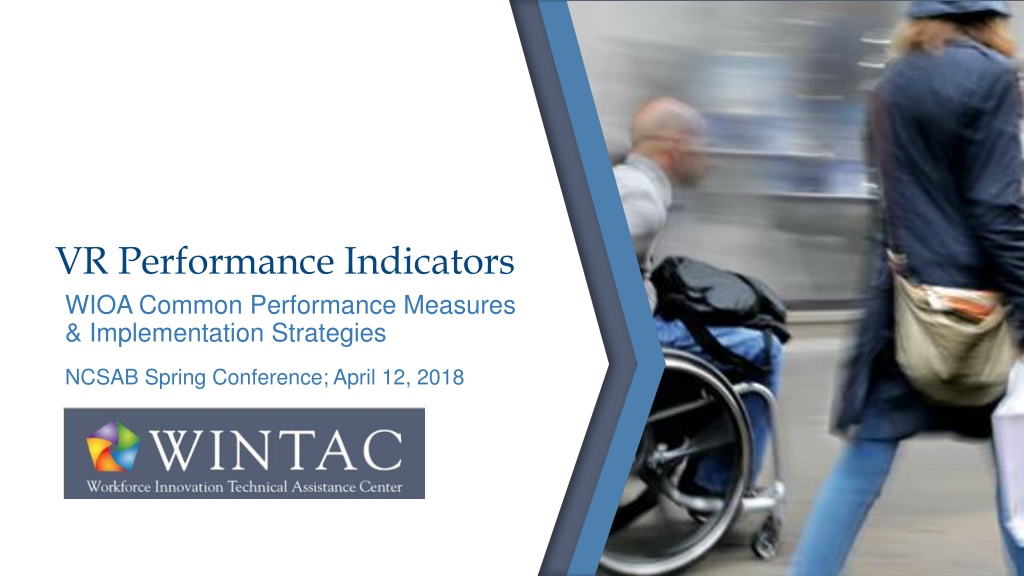
VR Performance Indicators WIOA Common Performance Measures & Implementation Strategies NCSAB Spring Conference; April 12, 2018
During This Session Develop a deeper understanding of the performance indicators required under WIOA. Identify areas of federal compliance vs. agency choice. Discuss strategies for measuring employee performance and adapting VR practice to meet WIOA expectations. Review New Jersey CBVI strategies for follow-up services, tracking and reporting. 2
Presenters Rachel Anderson, M.S., CRC, LVRC, WIP Technical Assistance and Training Workforce Innovation Technical Assistance Center (WINTAC) National Disability Institute (NDI) Amanda Gerson, M.S., Ed.S. Coordinator of VR and Transition Services New Jersey Commission for the Blind and Visually Impaired State of New Jersey Department of Human Services 3
WIOA Core Partners: Common Measures Labor Title I Workforce Development Activities Adult, Youth, Dislocated Worker Title III Amendments to the Wagner-Peyser Act Education Title II Adult Education & Literacy Title IV Amendments to the Rehabilitation Act of 1973 Vocational Rehabilitation Programs 4
VR Leadership and Program Improvement What are the goals and vision of your agency? How does this align with the WIOA requirements? Should we measure transition points along the way? How does this differ from your current or previous practice? What data do we need to evaluate system change? How do we access the information needed for reporting and evaluation of your agency, and identifying areas needing improvement? 5
NJCBVI Going well: Pre-ETS programming longstanding program Sub-minimum wage employment Needed enhancement: Quality over quantity Program Improvement/Program Evaluation/Quality Assurance/Supervision Needed change: 511 outreach CIE integrated settings/set-aside programs Pre-ETS tracking Reporting requirements, including post-exit Business engagement 6
What Do the VR Regulations Say? The foundation of the VR program is the principle that individuals with disabilities, including those with the most significant disabilities, are capable of achieving high quality, competitive integrated employment when provided the necessary services and supports. To increase the employment of individuals with disabilities in the competitive integrated labor market, the workforce system must provide individuals with disabilities opportunities to participate in job-driven training and to pursue high quality employment outcomes. Page 55631 Federal Register 7
WIA: VR Standards and Indicators 1.1: Change in employment from prior year; one more than prior year 1.2: Rehab Rate 1.3: Competitive Employment Rate 1.4: Significant Disability Rate 1.5: Wage ratio 1.6: Increase in self-support 2.1: Equal access to services 8
WIOA: Performance Accountability Indicators Common Performance Measures apply across all six core programs: 1. Employment Rate 2nd Quarter after Exit 2. Employment Rate 4th Quarter after Exit 3. Median Earnings in the 2nd Quarter after Exit 4. Credential Attainment Rate 5. Measurable Skill Gains 6. Effectiveness in Serving Employers 9
Employment Rate 2nd Quarter After Exit Percentage of participants in unsubsidized employment during the second quarter after exit from the program. 10
Employment Rate 4th Quarter After Exit Percentage of participants in unsubsidized employment during the fourth quarter after exit from the program. 11
Median Earnings in the 2nd Quarter After Exit Median earnings of those in unsubsidized employment during the second quarter after exit from the program. 12
How Do We Get Wage Data? Direct UI wage record match Federal or military employment records Supplemental wage information State Wage Interchange System (SWIS) 13
NJCBVI: Employment Indicator Implementation What strategies has NJCBVI implemented to assist in gathering data for the employment indicators? Communication with consumers regarding data collection needs UI Wage Records (in-state only) Post-Exit follow-up procedures by supervisors 14
Credential Attainment Rate Percentage of participants enrolled in an education or training program (excluding on-the-job training and customized training) who attain a recognized post-secondary credential or secondary school diploma or equivalent during participation in, or within one year of, exit from the program. 15
Types of Accepted Credentials Secondary School diploma or recognized equivalent Occupational certificate, including Registered Apprenticeship and Career and Technical Education educational certificates Associate s degree Bachelor s degree Occupational certification Graduate degree for purposes of the VR program Other recognized certificates of industry/occupational skills completion sufficient to qualify for entry-level or advancement in employment Occupational licensure 16
Post-Secondary Credential Highlights Awarded in recognition of an individual s attainment of measurable technical or industry/occupational skills necessary to obtain employment or advance within an industry/occupation Technical or industry/occupational skills based on standards developed or endorsed by employers or industry associations Neither certificates awarded by workforce development boards nor work readiness certificates are included because neither document the measurable technical or industry/occupational skills Must recognize technology or industry/occupational skills for specific industry/occupation rather than general skills related to safety, hygiene, etc., even if general skills certificates are broadly required to qualify for entry-level employment or advancement in employment 17
Secondary Credential Highlights A secondary diploma (or alternate diploma) is one that is recognized by a State and that is included for accountability purposes under the Elementary and Secondary Education Act of 1965 (ESEA), as amended by the Every Student Succeeds Act (ESSA). A secondary or recognized school equivalency certification signifies that a student has completed the requirements for a high school education. The types of recognized equivalents, for those not covered under ESEA, are those recognized by a State. 18
Examples: Credentials that DO NOT Count Examples of common certificates that do not meet the credential definition: Occupational Safety and Health Administration (OSHA), CPR/First Aid, Food Handlers, etc. Work/Career Readiness Certificates Completion of an Assistive Technology training program (e.g., screen reading software) Completion of Orientation and Mobility training Secondary School - Certificate of Completion 19
Measurable Skill Gains Percentage of participants who, during a program year, are in an education or training program that leads to a recognized post-secondary credential or employment and who are achieving documented academic, technical, occupational or other forms of progress towards such a credential or employment. 20
Measurable Skill Gains (continued) Five measures of documented progress that specify a skill gain: 1. Achievement of at least one educational functioning level, if receiving instruction below post-secondary education level 2. Attainment of secondary school diploma or equivalent 3. Secondary or post-secondary transcript for sufficient number of credit hours 4. Satisfactory progress report toward an established milestone from an employer or training provider 5. Passage of an exam required for an occupation or progress attaining technical/occupational skills as evidenced by trade-related benchmarks Participant based/1 gain/person/participation period 21
Examples: MSG that DO NOT Count Examples of common skills that do not meet the measurable skill gain definition: Yearly progression in Special Education while working toward a certificate of completion Transportation skill attainment (e.g. mastering use of public transportation) Soft Skills training Pre/Post tests demonstrating mastery of O&M skills Documented attainment of Microsoft Office skills in JAWS 22
Considerations for Blindness Agencies What are common training programs and skill-building services offered through your agency? Completion of an Assistive Technology training program (e.g., screen reading software) Completion of Orientation and Mobility training Blindness skills training program (training center) Why do these programs/services generally not count toward the credential attainment and MSG indicators? 23
NJCBVI: Questions How has NJ implemented policies, training, etc., to ensure understanding and accurate tracking and reporting of credentials and skill gains? VR 101 series Cheat sheets Data days Reviewing data for QA Still a work in progress? What errors or training needs are you finding? Strategies moving forward? How are you getting staff to understand the difference between the value of services offered through your agency and the performance measures, and that they are tracked differently, but still valuable? 24
Effectiveness in Serving Employers States choose 2-3 ways to measure level of performance; shared outcome among programs for the state: Retention with the same employer in the 2nd and 4th quarters after exit Employer Penetration Rate Repeat Business Customer Rate Piloting indicators in PY16 and PY17 States are encouraged to develop their own indicator 25
NJCBVI: Partners Core program partners Co-sponsored events with DVRS & One-Stops Collaborating with LWD and sharing SalesForce App (early adopter) Maintain relationship with SETC (state WIB) through SRC and their meetings Talent Networks membership and Targeted Industry Partnership attendance Pros/cons Pros: Increased bandwidth, utilizing existing connections, one-stop-shopping for businesses Cons: Different emphasis by partners, territorial of business relationships, building trust takes time 26
NJCBVI: Strategies and Challenges Strategies for moving forward Continued and expanded partnerships Co-sponsored events to increase trust and relationships with partners Focus on education and work experiences, internships and progressive employment Intentional collaboration to bring business reps from the different partners together Challenges Different departments, so we have to push in Candidate pipeline not as robust 27
Fiscal Year vs. Program Year October 16 September 17 Mo Tu We Th Fr Sa Su Mo Tu We Th Fr Sa Su Federal Fiscal Year (FFY) 1 2 1 2 3 3 4 5 6 7 8 9 4 5 6 7 8 9 10 10 11 12 13 14 15 16 11 12 13 14 15 16 17 Oct 1 Sept 30 17 18 19 20 21 22 23 18 19 20 21 22 23 24 24 25 26 27 28 29 30 25 26 27 28 29 30 31 July 17 June 18 Mo Tu We Th Fr Sa Su Mo Tu We Th Fr Sa Su Program Year (PY) 1 2 1 2 3 3 4 5 6 7 8 9 4 5 6 7 8 9 10 10 11 12 13 14 15 16 11 12 13 14 15 16 17 July 1 June 30 17 18 19 20 21 22 23 18 19 20 21 22 23 24 24 25 26 27 28 29 30 25 26 27 28 29 30 31
Baseline Data and Reporting Baseline Data Reporting Period Two years of reporting data: From July 1, 2017, through June 30, 2019 Baseline data will be used in Unified/Combined State Plans 2020 Quarterly Reporting: 911 Data to RSA Quarterly reports are submitted no later than 45 days of quarter s end Annual Report Due October 1 each year VR programs first Annual Report is due October 1, 2018 29
Annual Report: VR Agency Responsibility ETA 9169 Annual Report VR agencies will be required to calculate: Funds expended on Career Services (See TAC 17-01 Attachment 7, Table D for which services count as Career Services) Funds expended on Training Services (See TAC 17-01 Attachment 7, Table D for which services count as Training Services) Cost per participant served in Career Services Cost per participant serviced in Training Services Percent enrolled in more than one core partner program Effectiveness of Serving Employers information, if the VR agency is responsible for reporting this information 30
Post-Exit Follow-Up New Jersey Commission for the Blind and Visually Impaired (NJCBVI)
Background New counselors, large caseloads and a LOT of changes = decreased counselor bandwidth Already experiencing push-back from counselors, supervisors and managers due to increased expectations Increased emphasis on quality over quantity (not just 26s) BUT, decrease in quantity needed to be addressed Access to UI/Wage data limited to in-state Opportunity for supervisor QA involvement CHOICE: Supervisors to do post-exit follow-up on a quarterly basis 32
Procedure for Post-Exit Follow-Up Developed procedure, script and cheat-sheet for supervisors Assistance from WINTAC (Thanks, Rachel!) Letter sent to consumer s home, if unable to contact (3 attempts) Created spreadsheet for tracking (provided mid-point in quarter) Trained supervisors and managers on process Submit at the end of the quarter to Managers and VR Coordinator 33
Outcomes from Two Quarters of Follow-Up Benefits Greater supervisory oversight Re-opening cases Post-Employment, IL, and new case occurrences Challenges BIG CHANGE New reporting requirements = a lot of closures/clean-up of caseloads New procedure = Consumers not expecting follow-up calls, not answering phone, contact information changed No existing relationship with supervisors, hesitant to give information A LOT of self-employed/contracted work = not in wage database 34
NJCBVI: Next Steps VRCs to emphasize follow-up process to consumers VRCs to ensure updated contact information at closure Considering changes to frequency, role responsibility, assistance from admin staff/vocational assistants Additional sources of wage information and verification 35
Are WIA Standards and Indicators Still Valuable? VR program evaluation and improvement cannot be solely based on the WIOA Performance Indicators. Competitive Integrated Employment Rehab Rate Significance of Disability Other Reporting Requirements All are pieces of the VR Puzzle. 36
Compliance vs. Agency Choice WIOA and VR Regulation Compliance Data collection system is capable of capturing and reporting all the required data elements; VR staff have completed training necessary to ensure the collection and reporting of the required data elements; Internal control processes and policies and procedures to ensure the accuracy and validity of the data have been implemented. VR Agency Decisions and Choices Implementation of Supplemental Wage and Follow-Up Strategies Amendments of Counselor and other Staff Performance Evaluations Strategies for program improvement during the baseline reporting period 37
Recommendations for Blindness Agencies Suggestions and lessons learned from NJCBVI
Questions Thank you for attending!
Presenter Contact Information Rachel Anderson, WINTAC (435) 764-8487 randerson@ndi-inc.org rachel.anderson@wintac.org Amanda Gerson, NJCBVI (973) 648-3660 amanda.gerson@dhs.state.nj.us 40
Resources Workforce Innovation Technical Assistance Center (WINTAC) http://www.wintac.org New Jersey Commission for the Blind and Visually Impaired (NJCBVI) http://www.cbvi.nj.gov 41
