Understanding Sources of Tail Latency in Hardware, OS, and Applications
Delve into the impact of latency on revenue, with real-world examples from companies like Amazon and Google. Explore the complexities of achieving low tail latency in large-scale applications and the approach to analyzing and mitigating latency sources at hardware, OS, and application levels.
Download Presentation

Please find below an Image/Link to download the presentation.
The content on the website is provided AS IS for your information and personal use only. It may not be sold, licensed, or shared on other websites without obtaining consent from the author. Download presentation by click this link. If you encounter any issues during the download, it is possible that the publisher has removed the file from their server.
E N D
Presentation Transcript
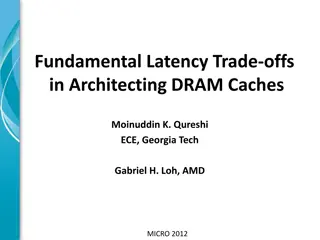
Tales of the Tail: Hardware, OS and Application-level Sources of Tail Latency Jialin Li, Naveen Kr. Sharma, Dan R. K. Ports and Steven D. Gribble Presented By: Tejala Thippeswamy
Agenda Introduction and Background The Approach Ideal Latency Distribution Testbed Timestamping Sources of Latencies Analysis, Mitigation and Measurement Putting it All Together Pros Cons and Discussion
Introduction and Background Latency and its effects: Latency translates directly to revenue Amazon found every 100ms of latency cost them 1% in sales A year-long performance redesign at ShipZilla resulted in a 5 second speed up resulting in a 25% increase in page views, a 7-12% increase in revenue. Marissa Mayer shared the results of an experiment conducted at Google where they increased the number of search results per page from 10 to 30, with a corresponding increase in page load times from 400ms to 900ms. The delay caused a 20% drop in traffic. Source
Introduction and Background System Type: Large scale, parallel and Interactive applications Objective: Achieve fast response times with low latencies Tail Latency In Facebook s Memcached deployment, median latency is 100 s and the 95th percentile with latency > 1ms Source A single user request spawns many more sub-tasks Overall latency and user request completion depends on the completion of the slowest subtask
The Approach used Study the behavior of three servers: RPC-server, Memcached, Nginx Establish the baseline for ideal latency distribution Measure the latency distributions observed on the three servers Identify the major sources contributing to tail-latency Analyze, quantify and mitigate these factors Iterate till the measured latency distribution comes as close to the ideal latency distribution
Ideal Latency Distribution Presumption: uniform with same response time for all requests Not so in realistic workloads!! why?? Model the service as a single-queue system - A/S/c queue Latency Characteristics Arrival Distributions Utilizations Parallel Servers feeding from one queue Queuing discipline
Arrival Distribution Utilization 90% 10x 99% 99% 99.9% 99.99% a single worker FIFO server a uniform request processing time of 50 secs operated at an average utilization of 70% CCDF
Parallel Servers Queuing discipline 99% 4x
Ideal Latency Distribution Given the application and arrival distribution of the workload, We can predict the time spent by a request in the server. Request Processing time estimation Running server on a single core at 100% utilization Measure the throughput achieved Estimate of amortized latency for single request (t)= inverted throughput Simulating a queuing model (A/S/c) using the measured Arrival times Request processing time (t) In case of Memcached, for a peak throughput at 125,000 requests per second per core the amortized processing time was 8 s per request.
Testbed Applications RPC Server Memcached Nginx Cluster of standard datacenter machines. 2 x Intel L5640 6 core CPU 24 GB of DRAM Mellanox 10Gbps NIC Ubuntu 12.04, Linux Kernel 3.2.0 All servers connected to a single 10 Gbps ToR switch. One server runs application, and five machines to run workload generating clients. Workload: Open-loop workloads(Poisson distribution)
Timestamping Start when a request packet first arrives on the host from the server s NIC, and end immediately before the OS transfers the response packet back to the NIC Append a 30-byte buffer to request packet Write the timestamps to the buffer as it goes through the server. After TCP/UDP processing Thread scheduled on CPU Incoming Server NIC Outgoing Server NIC Read() return Write() Circumvent the need for server to log requests.
Sources of Tail Latency Background Processes Non-FIFO Scheduling Multicore Interrupt Processing NUMA Effects Power Saving Optimizations Discussion focus: Memcached application
Impact of Background Process Impact? Timesharing of server application with background processes(BP) Wait for the CPU to be available, when blocked by a BPs The kernel allocates time slices that are a couple of milliseconds Tail amplification Fix? Niceness -20 (Max. Pri.) Realtime Scheduling Preemption Dedicated Core
Impact of Multicore-Concurrency Impact? By default, Memcached statically assigns incoming TCP connections to specific workers resembles a multi-queue system where each worker has its own request queue. Fix? Modify Memcached concurrency model to use a single queue Switch from TCP to UDP All threads pull requests from a single UDP socket
Impact of Interrupt Processing Impact? Linux runs the irqbalance daemon which spreads interrupts to the core Application threads are preempted by incoming interrupts Introduces context-switching and cache pollution higher latency Non - FIFO Fix? Dedicated core for interrupt processing 1 core Avoid preemption Ensure FIFO-ness
Impact of Power Saving Optimizations Impact? CPUs become idle, they can be placed in an energy saving state - C-state . Higher C-state requires a longer wake up time the clock frequency is reduced to save power Fix? Turn off Idle states and CPU frequency scaling But, comes at the cost of high energy use Memcached 10% utilization
Impact of NUMA Effects Impact? On scaling from multiple cores to multiple CPUs NUMA latency Increased processing time due to memory accesses across NUMA nodes Fix? Run an instance of Mem- cached per NUMA node. Force each instance to allocate only memory from the same NUMA node
Impact of Queuing Policy Impact? Threads are scheduled out-of-order by Linux Scheduler, CFS Fix? Use FIFO scheduler like realtime scheduler
Putting it all Together Explored hardware, OS and application-level sources of tail latency Pin-point sources using finegrained timestaming, and an ideal model Substantial improvements, close to ideal distributions. Median latency of Memcached from 100 s to 11 s 99.9th percentile latency of Memcached from 5 ms to 32 s. Source Background Processes Potential way to fix Use realtime scheduling, or run on dedicate core Ensure a global scheduling queue Use separate interrupt and application cores. Turn off idle states and CPU frequency scaling. Lower average utilization; add parallel workers. Concurrency Architecture Interrupt Processing Power Saving Features Request Burstiness
Pros Cons and Discussion Pro Timestamping Identification and the mitigation of the issues Con Trade offs mentioned OS level changes Evaluation not complete Workload (CPU bound only?) Is Preemption a good idea? What the sweet spot for utilization? NIC induced delays? What we should take away from this paper? Realize that these are possible causes for increased tail latency Depending upon application requirements and specs choose which cause can be mitigated
Open loop Source: http://download3.vmware.com/vcat/vcat31_documentation_center/inde x.html#page/Cloud%2520Bursting/7%2520Cloud%2520Bursting.2.05.html#w wpID0E0IF0HA Closed loop
