Understanding Secondary Organic Aerosol Formation from Volatile Chemical Products
This research explores the impacts of volatile chemical products (VCPs) on secondary organic aerosol (SOA) formation. By identifying chemical tracers, assessing VCP contributions, and analyzing VOC emissions in different cities, the study aims to enhance our understanding of air quality and sources of pollution.
Download Presentation

Please find below an Image/Link to download the presentation.
The content on the website is provided AS IS for your information and personal use only. It may not be sold, licensed, or shared on other websites without obtaining consent from the author. Download presentation by click this link. If you encounter any issues during the download, it is possible that the publisher has removed the file from their server.
E N D
Presentation Transcript
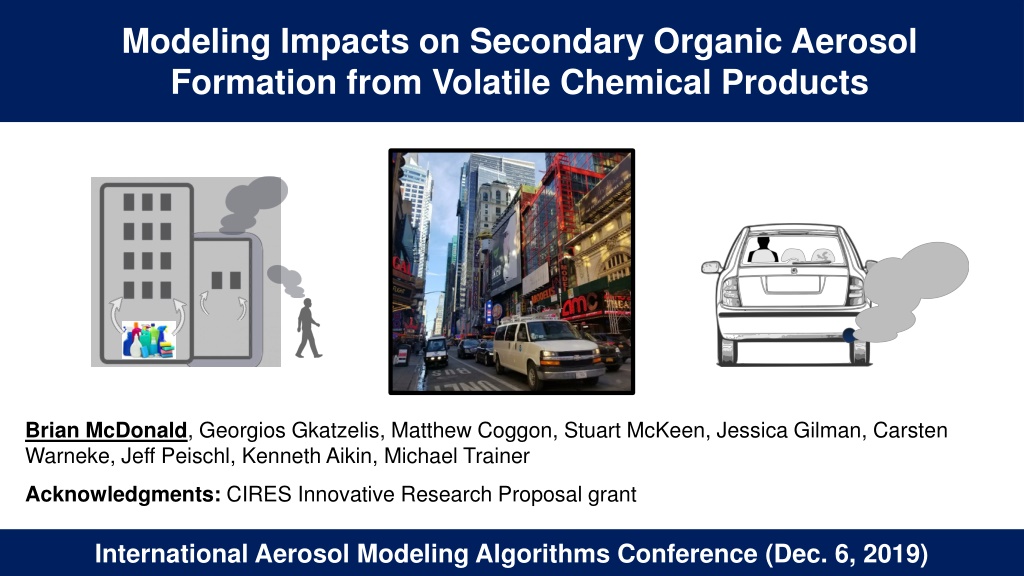
Modeling Impacts on Secondary Organic Aerosol Formation from Volatile Chemical Products Brian McDonald, Georgios Gkatzelis, Matthew Coggon, Stuart McKeen, Jessica Gilman, Carsten Warneke, Jeff Peischl, Kenneth Aikin, Michael Trainer Acknowledgments: CIRES Innovative Research Proposal grant International Aerosol Modeling Algorithms Conference (Dec. 6, 2019)
Long-Term Decreases in Motor Vehicle Emissions of VOCs mixing ratio (ppb) ln (VOC or CO) Warneke et al. (J. Geophys. Res. 2018) McDonald et al. (Science 2018)
Research Objectives (1) How ubiquitous are VCP emissions? Identify chemical tracers for VCPs Perform source apportionment of VOCs across cities (2) Assess VCP contributions to SOA using chemical transport model Define VCPs as coatings, inks, adhesives, personal care products, cleaning agents, pesticides [McDonald et al., Science 2018]
NOAA Ground and Mobile Laboratory VOC Measurements in 2018 WIN/SUM 2018 Denver SUM 2018 NYC Chicago WIN 2018 Pittsburgh Turbo pump Turbo pump Water in Water out Extractor MCP Ion source Drift Tube SSQ BSQ PB TOFMS Air in PTR-ToF-MS Reflectron Population density ranges from ~200 to ~30,000 ppl / km2
Identifying Chemical Tracers for VCP Sources Hypothesis: If a chemical is a marker for VCP emissions, then its ambient ratio relative to benzene will increase with population density. Benzene removed from VCPs Benzene primarily found in gasoline Per capita use of VCPs scales with population Per capita driving decreases with increasing pop. density
Personal Care Emissions Enhanced Relative to Traffic in Denser Cities Georgios Gkatzelis (NOAA) Cites included: New York, Chicago, Pittsburgh, Denver Coggon et al. (in preparation)
Chemical Markers Identified for Other VCP Source Sectors Coggon et al. (in preparation)
VCPs are Ubiquitous in Urban Environments (even in tunnels) Separation of tailpipe exhaust emissions from VCPs is challenging Gkatzelis et al. (in preparation)
Constrain On-Road Tailpipe Exhaust Emissions Profile Population density (km-2) B. Mobile Laboratory combustion dominated A. Derived T ailpipe Em issions Factor Profile 0 10000 20000 30000 ethanol 41.1 1 Conn. 0.30 New Jersey 0.1 New Y ork based on mobile measurements 41.0 NYC normalized combustion factor 0.25 0.01 0.001 40.9 0.20 Latitude C8 aromatics C9 aromatics 0.001 0.1 0.15 40.8 toluene acetone Caldecott C10 aromatics benzene 0.10 L o n g I s l a n d 40.7 0.05 40.6 0.00 5 6 7 8 9100 2 3 -74.2 -74.0 -73.8 -73.6 m/z Longitude Criteria to extract tailpipe emissions: High BTEX conc. C. US population density m ap Low conc. of VCP tracers Gkatzelis et al. (in preparation) Chicago Denver / Boulder NYC Pittsburgh Population density (km-2) 0 200 400 600 800 1000
Perform Constrained-PMF Analysis with 4 Factor Solution winter Boulder winter NYC summer NYC diurnals 1.0 0.8 0.6 0.4 0.2 0.0 4 3 2 1 contribution [ppbv] tailpipe emissions 10 8 6 4 2 33% 61% 21% 100 [ppbv] 8% VCPs dominated 35% 1% non-methane VOCs sources [ppbv] 2% 67% 11% 11% 80 30% 20% 5 4 3 2 1 60 [ppbv] daytime oxidation 40 0.3 [ppbv] 20 0.2 morning oxidation 0.1 0 0 10 hours Gkatzelis et al. (in preparation) 5 15 20 6.2 11.2 16.2 13.3 17.3 21.3 25.3 29.3 9.7 13.7 17.7
PMF Analysis of Ground Site Data Useful for Inventory Evaluation A. Mobile Laboratory observations VCP tracers increase relative to traffic tracers with population density B. Ground site observations Evaluation of the FIVE-VCP inventory for two population density extremes, Boulder and NYC Observations Inventory total Inventory overlap to observations NYC: New York City C: Chicago P: Pittsburgh D: Denver -1) 1.0 NYC (VCP tracers) / (BTEX) (ppb ppb 0.8 39% 27% pop. dens. 24% NYC NYC 18000 0.6 NYC NYC 76% 73% NYC 61% 0.4 C NYC D D P Boulder 0.2 47% 47% pop. dens. 34% D 2000 C 0.0 66% 53% 53% 5 10 15 20 25 tailpipe tailpipe VCPs tailpipe VCPs 3 (km -2) Population Density x10 VCPs dominated Tailpipe dominated by road traffic Off-road gasoline major tailpipe source Gkatzelis et al. (in preparation) C. Impacts of VCPs relative to tailpipe emissions extended for the US based on the FIVE-VCP inventory Emissions Reactivity SOA potential M 2 / day 250 2.0 M M 2 / day 60 2 / day C C C 200 50 3 g / km -1 / km 1.5 6 g / km 40 150 P P P 3 s VCPs off-road on road SOA potential x10 BR 1.0 30 BR BR B emissions x10 B BX B reactivity x10 BX 100 BX 20 Q Q Q 0.5 50 10 C C C P P B B P B 0 0 0.0 2 3 4 5 2 3 4 5 10 10 10 10 -2) 2 3 4 5 10 10 10 10 10 10 10 10 -2) Population Density (km -2) Population Density (km Population Density (km B: Boulder, P: Pittsburgh, C: Chicago, Q: Queens, BX: Bronx, BR: Brooklyn, M: Manhattan
A. Mobile Laboratory observations VCP tracers increase relative to traffic tracers with population density B. Ground site observations Evaluation of the FIVE-VCP inventory for two population density extremes, Boulder and NYC Observations Inventory total Inventory overlap to observations NYC: New York City C: Chicago P: Pittsburgh D: Denver -1) 1.0 NYC (VCP tracers) / (BTEX) (ppb ppb 0.8 39% pop. dens. 27% 24% NYC NYC 18000 0.6 NYC NYC 76% 73% NYC 61% 0.4 C NYC D D P Boulder 0.2 pop. dens. 47% 47% 34% D 2000 C 0.0 66% 53% 53% VCPs Account for 50 80% of the AVOC Emissions Population Density x10 5 10 15 20 25 tailpipe VCPs tailpipe VCPs tailpipe 3 (km -2) VCPs dominated VOC reactivity and SOA yields of VCPs comparable to mobile sources C. Impacts of VCPs relative to tailpipe emissions extended for the US based on the FIVE-VCP inventory Emissions Reactivity SOA potential M 2 / day 250 2.0 M M 2 / day 60 2 / day C C C 200 50 3 g / km -1 / km 1.5 6 g / km 40 150 P P P 3 s VCPs off-road on road SOA potential x10 BR 1.0 30 BR BR B emissions x10 B BX B reactivity x10 BX 100 BX 20 Q Q Q 0.5 50 10 C C C P P B B P B 0 0 0.0 2 3 4 5 2 3 4 5 10 10 10 10 -2) 2 3 4 5 10 10 10 10 10 10 10 10 -2) Population Density (km -2) Population Density (km Population Density (km B: Boulder, P: Pittsburgh, C: Chicago, Q: Queens, BX: Bronx, BR: Brooklyn, M: Manhattan Gkatzelis et al. (in preparation)
WRF-Chem Setup for Modeling Ozone and SOA during Summer 2018 Weather Research Forecasting with Chemistry Model (WRF-Chem) D1: 12 km x 12 km D2: 4 km x 4 km Model SOA with 4-bin VBS scheme (Ahmadov et al., JGR 2012) but IVOCs missing and modeled as HC8 Stuart McKeen (NOAA) Updated mobile source NOx (McDonald et al., ES&T 2018), power plant NOx (CEMS), and anthropogenic VOC emissions (McDonald et al., Science 2018).
A. NOxand BVOC only urban = 70 ppb, max = 96 ppb B. + Mobile VOC urban = 83 ppb, max = 111 ppb A. NOxand BVOC only urban = 70 ppb, max = 96 ppb B. + Mobile VOC urban = 83 ppb, max = 111 ppb High Ozone during July Heat Wave Enhanced by AVOCs A. NOxand BVOC only urban = 70 ppb, max = 96 ppb BVOC + NOx only D. NYC Ozone Plume C. + VCP VOC urban = 90 ppb, max = 118 ppb urban = 83 ppb, max = 111 ppb BVOC + NOx + AVOC B. + Mobile VOC D. NYC Ozone Plume C. + VCP VOC urban = 90 ppb, max = 118 ppb min max min max NYC NYC Good D. NYC Ozone Plume C. + VCP VOC urban = 90 ppb, max = 118 ppb Very Unhealthy for sensitive groups Very Unhealthy for sensitive groups Unhealthy Good Moderate (Unhealthy) Unhealthy Moderate Unhealthy Unhealthy ~ 24 million ppl 7,000 people 2.0 million people 7.8 million people 15 million people 1.6 million people 7,000 people 2.0 million people 7.8 million people 15 million people 1.6 million people min max NYC Very Unhealthy for sensitive groups Unhealthy Good Moderate Unhealthy 7,000 people 2.0 million people 7.8 million people 15 million people 1.6 million people
Anthropogenic SOA significant fraction of PM2.5 Mass Urban = 21 g m-3, max = 28 g m-3 Urban = 27%, max = 47% max min NYC Bias = +0.6 g m-3, r = 0.67 VCP SOA ~1 g m-3, but not accounting for IVOCs or heterogeneous chemistry
Summary (1) Identified several tracers for VCPs in urban atmosphere using PTR-ToF-MS VOC source apportionment in PMF analysis (2) Across four US cities with population density spanning 2 orders of magnitude, VCPs are 50-80% of the anthropogenic VOC emissions (3) Preliminary WRF-Chem modeling suggest VCPs can contribute to SOA, but likely under-accounted without representation of IVOCs
