Understanding Reservoir Connectivity and Its Impact on Recovery Models
Sand connectivity plays a crucial role in reservoir recovery, with reservoir properties' heterogeneity influencing connectivity. Field-based studies in the USA focus on water-flooding and injector-producer connectivity in channel sand reservoirs. Geostatistical models using percolation theory help study reservoir connectivity. Factors like inter-channel sandy facies, width/thickness ratios of channels, and floodplain aggradation rates affect reservoir connectivity. Geological models vary NTG, channel characteristics, and sinuosity to analyze connectivity variability.
Uploaded on Nov 17, 2024 | 0 Views
Download Presentation

Please find below an Image/Link to download the presentation.
The content on the website is provided AS IS for your information and personal use only. It may not be sold, licensed, or shared on other websites without obtaining consent from the author. Download presentation by click this link. If you encounter any issues during the download, it is possible that the publisher has removed the file from their server.
E N D
Presentation Transcript
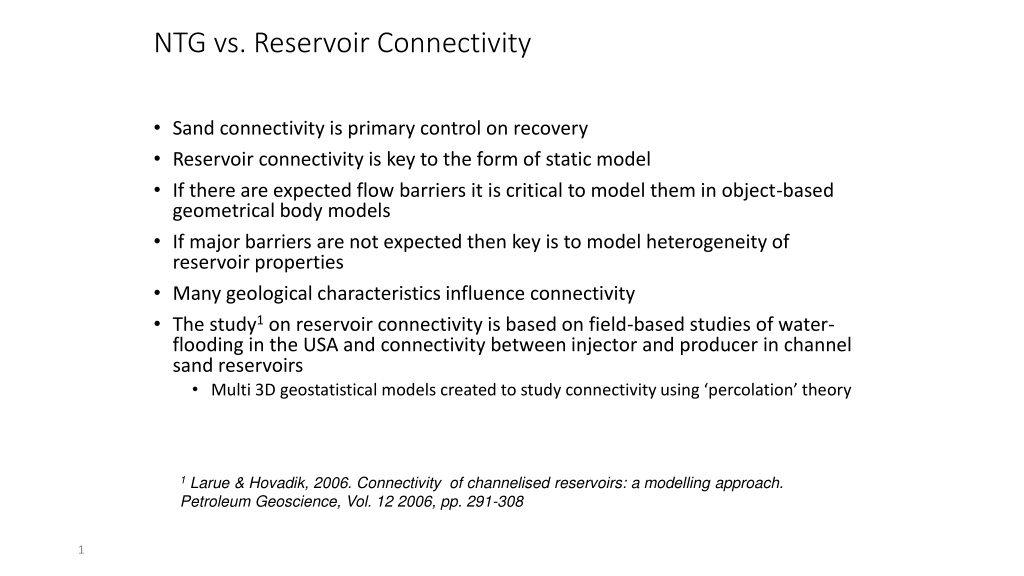
NTG vs. Reservoir Connectivity Sand connectivity is primary control on recovery Reservoir connectivity is key to the form of static model If there are expected flow barriers it is critical to model them in object-based geometrical body models If major barriers are not expected then key is to model heterogeneity of reservoir properties Many geological characteristics influence connectivity The study1 on reservoir connectivity is based on field-based studies of water- flooding in the USA and connectivity between injector and producer in channel sand reservoirs Multi 3D geostatistical models created to study connectivity using percolation theory 1 Larue & Hovadik, 2006. Connectivity of channelised reservoirs: a modelling approach. Petroleum Geoscience, Vol. 12 2006, pp. 291-308 1
Clear relationship between NTG and sand connectivity Connectivity vs. NTG 3D Model Different colours represent different characteristics of channel model (sinuosity etc) Graph based on 270 different Boolean models of channels using a wide variety of channel characteristics and simulations S curve Analysed connectivity using Percolation theory In 3D models percolation threshold for a variety of shapes is <20% and connectivity is very low until this threshold is reached >30% NTG and reservoir is highly connected 10%-30% NTG can result in 100% or 0% connectivity (Cascade zone) <30% NTG and reservoir may be poorly connected (not well defined) 2
Factors that cause better reservoir connectivity Inter-channel sandy facies connect channels increase connectivity A Higher width/thickness ratio of channels increases connectivity B Clusters or belts of channels result in sand units with greater width/thickness ratios and higher connectivity C Variable floodplain aggradation rates Rapid floodplain aggradation and overbank muds are preserved Slow aggradation and channels are preserved and amalgamate, and high NTG is preserved see D (orange channels) These factors shift the S curve of the connectivity vs. NTG graph to the right 3
11 geological models created varying NTG, width/thickness, channel thickness, stacking, sinuosity, channel deviation.300 realisations run for each model varying NTG from 0% to 100%. Shows greater variability than simpler 3D model caused by geological characteristics. The green S curves are central to where connectivity could be 0%-100% and is poorly defined. Conclusion: all models show >50% NTG = Good Connectivity. <35% NTG = rapidly reduction in connectivity SAND CONNECTIVITY % P50 Case: 35% NTG, channel width/thickness 50, channel thickness 5m, random stacking, sinuosity 1.5 Channels composed dominantly of bars show least variance and best connectivity Greater variance of models Models Arrow shows highest NTG with 0% connectivity NET TO GROSS % 4
