Understanding NGS Applications in Bioinformatics
Explore the world of Next-Generation Sequencing (NGS) applications in bioinformatics, covering topics such as RNA sequencing, big data challenges, storing genomic datasets, querying genetic information, and data visualization. Dive into the complexities of sequencing technologies, gene expression control mechanisms, and the utility of RNA in bridging the gap between DNA and protein analysis.
Download Presentation

Please find below an Image/Link to download the presentation.
The content on the website is provided AS IS for your information and personal use only. It may not be sold, licensed, or shared on other websites without obtaining consent from the author. Download presentation by click this link. If you encounter any issues during the download, it is possible that the publisher has removed the file from their server.
E N D
Presentation Transcript
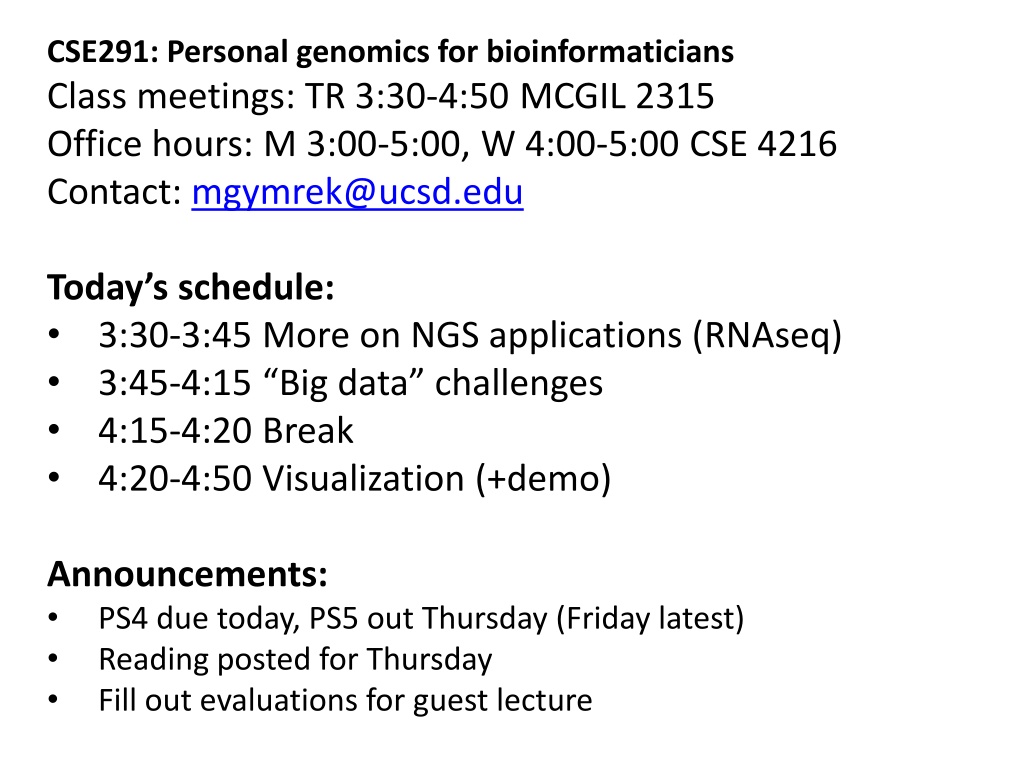
CSE291: Personal genomics for bioinformaticians Class meetings: TR 3:30-4:50 MCGIL 2315 Office hours: M 3:00-5:00, W 4:00-5:00 CSE 4216 Contact: mgymrek@ucsd.edu Today s schedule: 3:30-3:45 More on NGS applications (RNAseq) 3:45-4:15 Big data challenges 4:15-4:20 Break 4:20-4:50 Visualization (+demo) Announcements: PS4 due today, PS5 out Thursday (Friday latest) Reading posted for Thursday Fill out evaluations for guest lecture
Storing, querying, visualization CSE291: Personal Genomics for Bioinformaticians 02/28/17
Outline More on NGS applications Big data challenges in NGS Storing huge NGS datasets Querying genomic data Visualization
Sequencing is a really useful hammer Exome sequencing Whole genome sequencing Exon 1 Exon 2 Exon 3 TF DNA Promoter/Enhancer Transcription ChIP-sequencing ACACUAUCGAUGCAGAUAAAGUUGAGUAGCUGUCUCGGUCGAGCGUACGUAUAAAUCACUAC RNA Splicing ACACUAUCGAUGCAGAUAAAUAGCUGUCUCGCGUACGUAUAAAUCACUAC mRNA RNA sequencing Translation Protein (Protein sequencing is hard) See https://liorpachter.wordpress.com/seq/ for a near exhaustive list!
Phenotype controlled by which genes expressed DNA RNA Protein Real difference in the proteins, but hard to measure DNA ~identical! RNA is a useful intermediate! - ~Informative of protein level/sequence - Made from nucleic acids = we can sequence that! Skin cells Hepatocytes Neurons Red blood cells
RNAseq Exon 1 Exon 2 Exon 3 DNA Transcription ACACUAUCGAUGCAGAUAAAGUUGAGUAGCUGUCUCGGUCGAGCGUACGUAUAAAUCACUAC RNA Splicing PolyA tail ACACUAUCGAUGCAGAUAAAUAGCUGUCUCGCGUACGUAUAAAUCACUACAAAAAAAAA mRNA Convert to DNA, which we know how to sequence Reverse transcription 5 -ACACTATCGATGCAGATAAATAGCTGTCTCGCGTACGTATAAATCACTACAAAAAAAAA-3 3 -TGTGATAGCTACGTCTATTTATCGACAGAGCGCATGCATATTTAGTGATGTTTTTTTTT-5 cDNA complementary DNA Library prep + Sequencing
RNAseq standard pipeline Step 1: Align reads back to the reference genome (e.g. Tophat) Exon 1 Exon 2 Exon 3 Some reads span more than one exon Step 2: Quantify expression levels (e.g. Cufflinks) (RPKM=reads per kilobase per million reads) Gene Length # Reads RPKM (1M total) Gene1 1kb 4000 4000 Gene2 5kb 1000 200 Gene3 10kb 100 10
Challenges in analyzing RNAseq - alignment Exon 1 Exon 2 Exon 3 Due to alternative splicing, multiple possible transcripts (isoforms): Exon 2 Exon 1 Exon 3 Exon 1 Exon 3 Exon 2 Exon 1 Challenges: Reads spanning more than one exon don t match reference genome Solution: index the transcriptome, align to that instead Reads arising from novel or misannotated exons won t map Reads spanning exon-exon junction not in reference transcriptome won t map
Challenges in RNAseq abundance/isoforms A single gene can have many possible isoforms Exon 2 Exon 1 Exon 3 Exon 1 Exon 3 Exon 2 Exon 1 In many cases, ambiguous which transcript each read originated from Potential solutions: Ignore isoforms, focus on gene-level quant Long reads: PacBio can sequence whole isoforms in one read Graph-based models to assemble simplest transcript reassembly based on junction spanning reads
Kmer-based methods for RNA-seq Key idea: get rid of the alignment step! Instead: index the transcriptome based on kmers. Kmer counting in reads is much faster than alignment! Quantify expression using EM method. Iteratively estimate abundance, reallocate kmers to transcripts
Expression and chromatin structure are heritable Quantitative trait locus = a locus whose genotype is associated with a quantitative trait Multi-phenotype QTLs Expression QTL (eQTL) www.gtexportal.org McVicker et al. Science 2013
Expression and chromatin structure are heritable Allele Specific Expression: one allele is expressed more than expected by chance Castel et al. Genome Biology 2015
Challenge: the data is really big Single high coverage BAM file: 200G 1000 Genomes Project: 200Tb Short Read Archive (SRA): 1 petabyte EMBL-EBI: 10 petabytes PromethION (Nanopore): 6.2TB/48 hours! (Google has 15 exabytes) But still Datasets are certainly too big for laptops Getting too big for clusters Copying from one place to another is slow and wastes resources
Challenge: the data is scattered Sanger Sanger UCSD Cloud (AWS, Google, NIH) WUSTL Broad U. Mich Efforts to aggregate: http://exac.broadinstitute.org/ (more on this later)
More challenges Big data takes lots of time to analyze. Example expensive steps: Alignment with bwa-mem Variant calling with GATK Data generated in multiple places may not be uniformly processed, hard to compare Adding to that, pipelines are not well documented. We used a custom perl script to Access may be restricted due to privacy/legal concerns. Different policies for different datasets NIH data sharing policy E.g. deCODE, 100,000 Genomes Project May need to apply for access: e.g. dbGAP
Questions that should be easy to answer, but theyre not For a newly discovered variant, has this variant been observed in any other study? For a given variant, how many times as it ever been observed? What about in people with a specific ancestry background? How many genomes from diabetic patients have ever been sequenced? Of all people with a given mutation and connected health data, what phenotypes did they have?
Potential solutions Buy more storage (quick fix, but NGS quickly outstripping our storage capacity) Throw away some of the data We used to keep the image files, now just keep the reads Do we need to store all the quality scores? Maybe we only need to store variants from the reference? In some cases, cheaper to resequence than to store? Compress the data BAM does that somewhat. Can we do better?
What is data compression BMP, 190 kb PNG, 100 kb JPG, 21 kb JPG, 4 kb LOSSLESS LOSSY (reversible, all information is retained) (irreversible, some information is lost) http://www.ebi.ac.uk/sites/ebi.ac.uk/files/groups/ena/documents/esgi_cram_oct_2013.ppt
A spectrum of compression needs Cochrane, Cook, and Birney GigaScience 2012
SAM/BAM format SAM (sequence alignment/map format): text file (uncompressed) ERR194146.1 153 chr17 GATCACAGGTCTATCACCCTATTAACCACTCACGGGAGCTCTCCATGCATTTGGTATTTTCGTCTGGGGGGTATGCACGCGATAGCATTGCGAGACGCTGG \ :++:CA>A>3C@:A???DCC:@>?4?>4<0BB=BCCCDB?<@ACDCDCA?@9AC?7='B=4C=5/F@GFHCG@D@GEIGGBBF@GC@HAAHHHDBDDD@?< 22020727 2 101M = 22020727 0 \ BAM: binary file (lossless compression) BGZF: block compression format implemented on top of gzip Consist of series of concatenated gzipped blocks, each at most 64kb Store positions of each block in an index to allow fast random access Similarly: VCF format, binary BCF format uses BGZF
CRAM format Reference-based compression Main Idea: Efficient storage of places that are identical or near identical to the reference genome Objectives: (CRAM format specification) 1. Significantly better lossless compression than BAM 2. Full compatibility with BAM 3. Effortless transition to CRAM from using BAM files 4. Support for controlled loss of data from BAM files See the full specification here: http://samtools.github.io/hts-specs/CRAMv3.pdf
CRAM steps 1. Store the lookup position of each read on the reference (read lengths compressed using Huffman coding) 1. Order reads by start position to allow relative encoding of positions by storing differences between successive values 1. Store variation from the reference as an offset relative to read start. One data structure for subsitutions, insertions, deletions 1. Store read pair info an offset from the first read CRAM header gives info about reference sequences, stored separately Fritz et al. Genome Research 2011
CRAM - results Fritz et al. Genome Research 2011
CRAM - challenges Soft clipped reads (recall e.g. CIGAR score 30S71M) Convenient for reads where chunks don t align to soft clip the ends Creates overhead for CRAM, as each soft clipped read counts as an edit. Tradeoffs for removing/keeping soft clipped reads? Unmapped reads Assemble unmapped reads into an additional reference . Not biologically accurate, but gives a way to compress sequences that don t map. Base qualities Approach 1: shrink scores (e.g. from 0-39 to 0-7) (lose resolution) Approach 2: preserve only scores for mismatching bases. We rarely use quality scores for other bases anyway.
CRAM more on base qualities N40-D8: preserve quality scores for non-matching bases with full precision, and bin quality scores for positions flanking deletions. m5: preserve quality scores for reads with mapping quality score lower than 5 R40X10-N40: preserve non-matching quality scores and those matching with coverage lower than 10 *8: bin all quality scores https://github.com/enasequence/cramtools
Working with CRAM files Samtools (https://github.com/samtools/samtools) Works seemlessly with CRAM files (e.g. PS4) E.g. samtools view, tview, mpileup Convert between CRAM<->BAM<->SAM CRAMtools (https://github.com/enasequence/cramtools) Cram (SAM/BAM -> CRAM) Bam (CRAM->BAM) Can specify lossy or lossless model Index (produces .crai index file) Merge (merge SAM/BAM/CRAM files into one) Fastq (dump reads to fastq format) Getref (download all relevant reference sequences)
Alternative solutions for compressing NGS Hdf5 (Hierarchical Data Format) https://support.hdfgroup.org/HDF5/ Flexible format used to store large, structured data (not just sequencing) H5: Used by Pacbio to store long reads in fasta-like format Fast5: Nanopore file format based on HDF5 Others (ReducedBam, cSRA, Goby, biohdf) have not caught on. Good discussion on this topic: https://www.biostars.org/p/106047/
Searching for a genomic location the nave way Searching line by line: > samtools view NA12878.bam | awk '($3=="chr5" && $4==5999)' >1 hour Have to search every line until we find the reads we want!
Indices allow random access to genome files - BAM > samtools index NA12878.bam Creates NA12878.bam.bai > samtools view NA12878.bam chr5:10000-10001 0.088s BAM Index: Bin genomic regions, store in R tree (data structure for indexing spatial information) Index alignments by bin, check all alignments in that bin for overlap
Tabix Build the index: > tabix p vcf NA12878.vcf.gz Creates NA12878.vcf.gz.tbi Query: > tabix NA12878.vcf.gz chr5:10000-11000 Tabix: Generalization of BAM index to generic tab delimited files Supports access through ftp/http: quick retrieval of subset of genome over a network
The global alliance Spearheaded by one of my mentors, David Altshuler! http://genomicsandhealth.org/ Analogy to HTML Mission: The mission of the Global Alliance for Genomics and Health is to accelerate progress in human health by helping to establish a common framework of harmonized approaches to enable effective and responsible sharing of genomic and clinical data, and by catalyzing data sharing projects that drive and demonstrate the value of data sharing. Working Groups: Clinical (scalable approaches to link diverse genotype/phenotype datasets) Data (data representation and storage, standards & APIs) Ethics (how to harmonize diverse ethical/legal/privacy procedures) Security (technical standards for data access control, privacy)
Challenges in visualizing genomic data We want interactive visualization tools, but data is BIG and want interaction tools to be FAST Data is scattered. Ideally we can interact with data without having to download it to our own laptop or server Data is diverse. Need to work with standard file formats for interoperability We d like our visualizations to be pretty and fun to work with! (and also informative) Big design component.
Alignment viewers Samtools tview Super easy to use, command line based Intuitive display Limited to one sample, not good for figures Integrative Genomics Viewer (IGV) Overlay tons of tracks, integrate with projects like ENCODE UCSC Genome Browser Similar to IGV, but runs in web browser and includes other suites of tools PyBamView Inspired by samtools tview Better display of indels Works over web browser, easy to share links with collaborators Publication ready screenshots
Other visualization tools ExAC: http://exac.broadinstitute.org/ Largest project for aggregating genomic data Plus excellent visualization portal IOBIO: flexible framework to visualize BAM/VCF files http://bam.iobio.io/ http://vcf.iobio.io
Links for visualization demo: https://docs.google.com/document/d/1ujs02IUxC- omjIQ2vHidcmoCzXO3UEExhxwgfwP72UY/edit?usp =sharing
