Understanding Mendel's Experiments: Crosses and Punnett Squares
Mendel's groundbreaking experiments with pea plants led to the discovery of genetic inheritance patterns involving dominant and recessive traits. Through detailed cross-breeding studies and the use of Punnett squares, Mendel demonstrated how traits are passed down from one generation to the next, paving the way for modern genetics.
Download Presentation

Please find below an Image/Link to download the presentation.
The content on the website is provided AS IS for your information and personal use only. It may not be sold, licensed, or shared on other websites without obtaining consent from the author. Download presentation by click this link. If you encounter any issues during the download, it is possible that the publisher has removed the file from their server.
E N D
Presentation Transcript
Mendels Crosses and Punnett Squares
Segregation Mendel had identified 7 pea traits. When Mendel crossed plants with contrasting characters for the same trait, the resulting offspring had only one of the characters. From the results of these experiments, Mendel conclude that factors that do not blend control the inheritance of traits and that some of these factors are dominant, whereas other are recessive.
Mendels first cross of two types of pure bred plants resulted in a variety of different hybrid plants, depending on the traits that were crossed. He did not stop there. Mendel wanted to know what happened next. Mendel then allowed all of the hybrid plants to self fertilize in an attempt to see what happened to the recessive trait.
To keep things organized, Mendel gave the different groups of plants different names. P Generation: purebred parental plants F1Generation: first generation of plants produced by cross-pollination F2Generation: the generation of offspring from F1 plants that were crossed among themselves
F1Cross The results of the F1cross were remarkable. The recessive characters had not disappeared! Some of the F2plants produced by F1crosses showed the recessive trait. Mendel suggested that during the formation of the reproductive cells, the dominant and recessive alleles in the F1plant were segregated, or separated, from each other. The possible gene combinations in the offspring that result from a cross can be determined by drawing a diagram known as a Punnett Square.
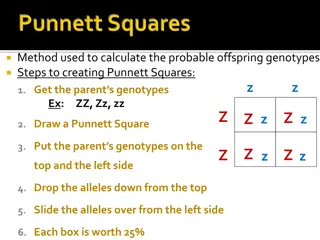
Punnett Squares Dominant alleles are represented by a capital letter, where as recessive alleles are represented by the corresponding lower case letter. A Punnett square shows the type of reproductive cells, or gametes, produced by each F1parent along the top and left-hand side of the square. It also, shows each possible gene combination for the F2offspring.
This Punnett square shows the cross between plants with yellow seeds and green seeds. The cross between the true-breeding P plants produces F1 heterozygotes that can be self- fertilized. The self-cross of the F1 generation can be analyzed with a Punnett square to predict the genotypes of the F2 generation. Given an inheritance pattern of dominant recessive, the genotypic and phenotypic ratios can then be determined. In pea plants, round peas (R) are dominant to wrinkled peas (r). You do a test cross between a pea plant with wrinkled peas (genotype rr) and a plant of unknown genotype that has round peas. You end up with three plants, all which have round peas. From this data, can you tell if the parent plant is homozygous dominant or heterozygous? Phenotype Genotype Genotype Phenotype Ratio Ratio
Organisms that have two identical alleles for a particular trait (TT or tt) are said to be homozygous (homo same; zygous alleles). Organisms that have two different alleles for a particular trait (Tt) are heterozygous (hetero different).
Independent Assortment After establishing that alleles segregate during the formation of gametes, Mendel began to explore the question of where they do so independently. Does the segregation of one pair of alleles affect the segregation of another pair of alleles? Does the gene that produces seed shape have anything to do with seed colour?
Mendel then crossed round yellow seeds (RRYY) with wrinkled green seeds (rryy). Because two traits are involved in this experiment, it is called a two-factor cross. The plant that bears round yellow seeds produces the alleles R and Y or RY gametes. The plants that bears wrinkled green seeds produces the alleles r and y or ry gametes. An RY gamete and ry gamete produce a fertilized egg with the genotype RrYy (F1).
Only one kind of plant will then grow for the F1 generation: 1. Genotype RrYy 2. Phenotype round and yellow We now have the hybrid F1 generation needed for the next cross.
A dihybrid cross in pea plants involves the genes for seed color and texture. The P cross produces F1 offspring that are all heterozygous for both characteristics. The resulting 9:3:3:1 F2 phenotypic ratio is obtained using a Punnett square. In pea plants, purple flowers (P) are dominant to white (p), and yellow peas (Y) are dominant to green (y). What are the possible genotypes and phenotypes for a cross between PpYY and ppYy pea plants? How many squares would you need to complete a Punnett square analysis of this cross?
Independent assortment If the genes are not connected, then they should segregate independently.
The gametes produced by the F1 individuals must have one allele from each of the two genes. For example, a gamete could get an R allele for the seed shape gene and either a Y or a y allele for the seed color gene. It cannot get both an R and an r allele; each gamete can have only one allele per gene. The law of independent assortment states that a gamete into which an r allele is sorted would be equally likely to contain either a Y or a y allele. Thus, there are four equally likely gametes that can be formed when the RrYy heterozygote is self- crossed, as follows: RY, rY, Ry, and ry.
Arranging these gametes along the top and left of a 4 4 Punnett square gives us 16 equally likely genotypic combinations. From these genotypes, we find a phenotypic ratio of 9 round yellow:3 round green:3 wrinkled yellow:1 wrinkled green. These are the offspring ratios we would expect, assuming we performed the crosses with a large enough sample size.


