Understanding Index Numbers and Their Importance in Business Decision Making
Index numbers are time series that measure relative changes over time, expressing counts or measurements as a percentage of a base period. Learn about base periods, calculation methods, and examples of simple relative and aggregate index numbers in business decision-making contexts.
Download Presentation

Please find below an Image/Link to download the presentation.
The content on the website is provided AS IS for your information and personal use only. It may not be sold, licensed, or shared on other websites without obtaining consent from the author. Download presentation by click this link. If you encounter any issues during the download, it is possible that the publisher has removed the file from their server.
E N D
Presentation Transcript
Business Decision Making Index Numbers (Price Index)
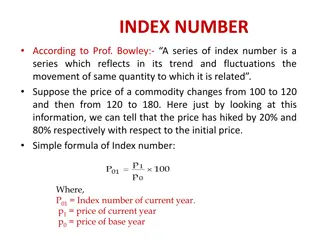
What are Index Numbers? Index numbers: are time series that focus on the relative change measurement over time. express the count or measurement as a percentage of the comparable count or measurement in a base period. in a count or
Base Period for Index Numbers? The base period is arbitrary but should be a convenient point of reference. The value of corresponding to the base period is always 100. The base period may be a single period or an average of multiple adjacent periods. an index number
Simple Relative Index A simple relative index shows the change in the price, quantity, or value of a single commodity over time. Calculation of a simple relative index: Index in period t = Price/Quan tity/Value period in t 100 Price/Quan tity/Value in base period
Example: Simple Relative Index Price Index 1980 as base year 100.0 Price Index 1990 as base year ? ? 100.0 ? Year 1980 1985 1990 240 1995 Price$ 140 195 ? ? ? 275 Computation of index for 1985 (1980 as base year): PtP 195 = P = 100 = 100 100 139 = 3 . Index 1985 P 140 1985 0 1980
Example: Simple Relative Index (Cont...) Price Index 1980 as base year 1990 as base year 100.0 139.3 171.4 196.4 Price Index Year 1980 1985 1990 240 1995 Price$ 140 195 58.3 81.3 100.0 114.6 275
Simple Aggregate Index A simple aggregate index shows the change in the prices, quantities, or values of a group of related items. Each item in the group is treated as having equal weight for purposes of comparing group measurements over time. Calculation of index number: Sum of items all period in t = Index Period in t 100 Sum of items all in base period
Example: Simple Aggregate Index Simple Aggregate Index, for Cars & Trucks Sold (1995 as base yr) ? 100.0 ? ? Cars Sold 423 Trucks Sold 141 165 184 215 Yr 1994 1995 435 1996 440 1997 455 Illustration of computation of index for 1994: = Qt Q 141 + 423 ( = ) 100 100 94 = ) 0 . Index 165 + 435 ( 1994 0
Example: Simple Aggregate Index (Cont...) Simple Aggregate Index, for Cars & Trucks Sold (1995 as base yr) 94.0 100.0 104.0 111.7 Cars Trucks Sold 141 165 184 215 Year Sold 1994 1995 435 1996 440 1997 455 423
Weighted Aggregate Index Simple aggregate index numbers may not be valid in comparing groups of items because of differences in volumes of the items used or differences in the units of measurement. In measurement of each item is multiplied by an appropriate weighting factor before being aggregated with other items to obtain a combined measurement. a weighted aggregate index, the
Weighted Aggregate Index: Selecting Weights To make sure that the changes indicated by the index numbers focused on the aspect of interest such as price or quantity, the same weighting factors must bee used to aggregate measurements in the selected period and the base period. In weighted aggregate corresponding quantities are often used as weighting factors. In weighted aggregate quantity index, the corresponding prices are often used as weighting factors. price index, the
Weighted Aggregate Price Index: Consumer Price Index (CPI) CPI, an example of weighted aggregate price index, is used to reflect the overall changes in the cost of goods and services purchased by a typical consumer. Applications: Indicator of rate of inflation Used to adjust wages to compensate for lost purchasing power due to inflation Used to convert a price or wage to a real price or real wage to show the equivalent amount in a base period after adjusting for inflation.
Weighted Aggregate Price Index There are two different weighted aggregate price indices such as Laspeyres Price Index (LPI) and Paasche Price Index (PPI). Both indices use corresponding quantities as the weighting factor. LPI uses corresponding quantities of the base year whereas PPI uses corresponding quantities of the current period. LPI = ?? ?? PPI = ?? ?? ?? ?? ??? ?? ?? ???
Laspeyres Price Index (LPI) LPI = ?? ?? ?? ?? ??? Pi = Prices of goods/services in the current year Q0 = Quantities of good/service in the base year P0 = Prices of goods/services in the base year
Laspeyres Price Index (LPI) Example Calculate the Laspeyres Price Index for the given period of time. Quantities of goods: Prices of goods: Good Year 0 Year 1 Year 2 Good Year 0 Year 1 Year 2 A 75 100 120 A 8 5 10 B 90 110 130 B 5 7 9 C 115 145 150 C 20 23 26
Laspeyres Price Index (LPI) Solution LPIyear 0 = 8 75 + 5 90 +(20 115) 8 75 + 5 90 +(20 115) 100 = 600+450+2300 600+450+2300 100 = 100 5 75 + 7 90 +(23 115) 8 75 + 5 90 +(20 115) 100 = 375+630+2645 LPIyear 1 = 600+450+2300 100 = 3650 3350 100 = 108.96 10 75 + 9 90 +(26 115) 8 75 + 5 90 +(20 115) 100 = 750+810+2990 LPIyear 2 = 600+450+2300 100 = 4550 3350 100 = 135.82
Laspeyres Price Index (LPI) Advantages Most widely used and easy to calculate index in measuring the price changes of a basket of goods and services relative to the base year s weighting. There is no need of having quantities of the future time period since formula is based on the quantities of the base year. Hence, it is cheaper to construct too. Disadvantages This tends to overstate price increases and hence, overestimates price levels and inflation.
Paasche Price Index (PPI) PPI = ?? ?? ?? ?? ??? Pi = Prices of goods/services in the current year Qi = Quantities of good/service in the current year P0 = Prices of goods/services in the base year
Paasche Price Index (LPI) Example Calculate the Paasche Price Index for the given period of time. Quantities of goods: Prices of goods: Good Year 0 Year 1 Year 2 Good Year 0 Year 1 Year 2 A 75 100 120 A 8 5 10 B 90 110 130 B 5 7 9 C 115 145 150 C 20 23 26
Paasche Price Index (PPI) Solution PPIyear 0 = 8 75 + 5 90 +(20 115) 8 75 + 5 90 +(20 115) 100 = 600+450+2300 600+450+2300 100 = 100 5 100 + 7 110 +(23 145) 8 100 + 5 110 +(20 145) 100 = 500+770+3335 PPIyear 1 = 800+550+2900 100 = 4605 4250 100 = 108.35 10 120 + 9 130 +(26 150) 8 120 + 5 130 +(20 150) 100 = 1200+1170+3900 PPIyear 2 = 960+650+3000 100 = 6270 4610 100 = 136.01
Paasche Price Index (PPI) Advantages It shows current consumption patterns by taking current quantities into consideration. It is not upward-biased compared to LPI. Disadvantages It may be difficult to obtain current weightings (Current quantities). It tends to understate the price changes.
This is time for your questions... -THANK YOU-


