Understanding Hypothesis Testing and its Six Steps
Learn about hypothesis testing, a procedure to determine the likelihood of mutually exclusive statements. Explore parametric vs. non-parametric tests, directional vs. non-directional hypotheses, and the six steps involved in hypothesis testing, including assumptions about the population and sample.

Download Presentation

Please find below an Image/Link to download the presentation.
The content on the website is provided AS IS for your information and personal use only. It may not be sold, licensed, or shared on other websites without obtaining consent from the author. If you encounter any issues during the download, it is possible that the publisher has removed the file from their server.
You are allowed to download the files provided on this website for personal or commercial use, subject to the condition that they are used lawfully. All files are the property of their respective owners.
The content on the website is provided AS IS for your information and personal use only. It may not be sold, licensed, or shared on other websites without obtaining consent from the author.
E N D
Presentation Transcript
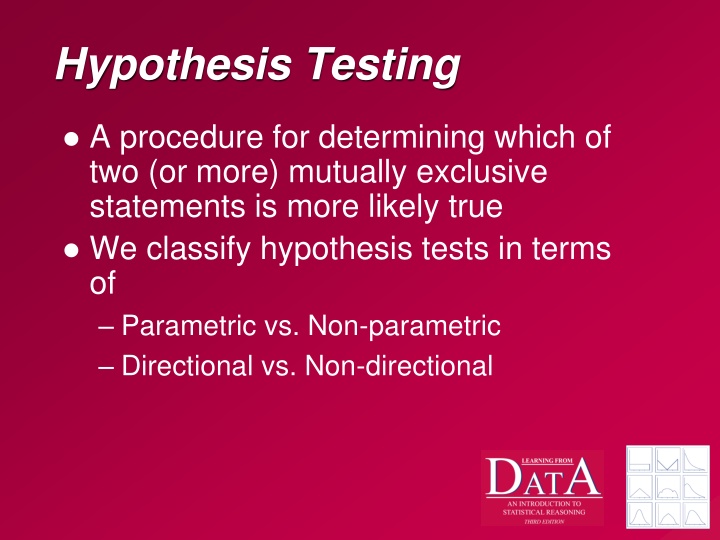
Hypothesis Testing A procedure for determining which of two (or more) mutually exclusive statements is more likely true We classify hypothesis tests in terms of Parametric vs. Non-parametric Directional vs. Non-directional
Hypothesis Tests Parametric Tests - tests about specific population parameters ( , 2, etc.) Is 1different from a predetermined value? Is 1different from 2? Non-Parametric Tests - tests about the shape of the population (medians?) Is this population different from another population?
Hypothesis Tests Non-Directional Hypothesis Is 1different from 2? Is the distribution of scores in group 1 different than those in group 2? Directional Hypotheses Is 1greater than 2? Is 1less than 2? Is the distribution of scores in group 1 to the right (greater than) of those in group 2?
The Six-Steps of Hypothesis Testing 1. State and Check Assumptions 2. Generate Null and Alternative Hypotheses 3. Chose the Sampling Distribution of the Test Statistic 4. Set Significance Level 5. Compute the Test Statistic 6. Draw Conclusions
1. State and Check Assumptions There are three requirements for hypothesis testing to work Assumptions about the population Assumptions about the sample
Assumptions about the Population Assumption of Normality - the population is normally distributed or the sample size is sufficiently large so that the CLT comes into play and
Assumptions about Variance Depending of the type of test, some important features of variance may come into play Is or 2 known? Homogeneity of Variance - the variance of the populations being compared have equal variance
Assumptions about the Sample The sample has been obtained using independent random sampling
What if the assumptions can t be met? Violation - when assumptions are not met Violation of Normality = Non-normal Violation of Homogeneity of Variance = Heterogeneous Variance Robust - a test s ability to deal with violations a t-test is robust to violations of normality
BUT, ... No tests are robust to violations of the random sampling assumption. If you do not have a random sample, probability theory will not work and therefore inferential statistical techniques will fail.
2. Generate Null and Alternative Hypotheses These two hypotheses, designated HO and HA (or H1), are mutually exclusive mutually exclusive - the don t overlap
Properties of HO Specifies no difference or no change from a standard or theoretical value Always specifies something about a particular population parameter Used in constructing a sampling distribution For the subsequent quantitative work, the null hypothesis is assumed to be true
Properties of HA (or H1) About the same aspect of the population as HO Usually stated in general terms Mutually exclusive - no overlap with HO Used in making a decision Can be directional or non-directional
Directional vs. Non-directional HAs Non-directional HA- usually stated as does not equal or is different than Directional HA- stated as greater than or less than note that a non-directional hypothesis is equal to the two directional hypotheses greater than or less than
3. Chose the Sampling Distribution Depending on the type of data, assumptions, and hypotheses certain distributions of the test statistic require selection The second half of this course will be devoted to making the best decision about which test statistic to choose (z, t, F, etc.)
4. Set Significance Level Hypothesis testing is sometimes called significance testing The significance level is the basis for making our decision rejection region - the value specified by the significance level of the test critical value - the value of the test statistic specified by the significance level that begins the rejection region
Significance Level The probability value associated with the decision rule is called the significance level of the test Significance level is represented by the Greek letter alpha ( ) The actual value of is up to you
What is the significance level? Hypothesis testing entails determining which of two hypotheses (HOand H1) is more likely correct. But more likely is a subjective evaluation on your part. If you were to obtain a statistic that was unlikely if HOwere assume to be true, would you be willing to accept the H1? How unlikely does it need to be for you to be convinced?
Typical Significance level A Typical significance level : = .05 We are convinced that results are considered as significant different from the HO when they are in the most extreme 5% (a proportion of .05) of all possible outcomes specified in HO
Using With our significance level, we determine a decision rule Critical Value the sufficiently extreme value of the statistic such that if our statistic is more extreme, we reject the HO p-value if the probability of our statistic, assuming HOis true, is less than , we reject the HO
5. Compute the Test Statistic From the random sample obtained, the test statistic is computed using various formulae z-statistic binomial probability t-statistic F-statistic etc.
6. Draw Conclusions Based on the test statistic just computed, we do one of two things: Reject the null hypothesis and accept the alternative hypothesis, or Do not reject the null hypothesis and do not accept the alternative hypothesis Note that we NEVER accept the null hypothesis, we only fail to reject it!
More on Decisions When completed, a significance test tells us the probability of obtaining our results when the null hypothesis is true p(Results|Hois True) If that probability is small, smaller than our significance level ( ), it is likely that Hois not true and we reject it


")