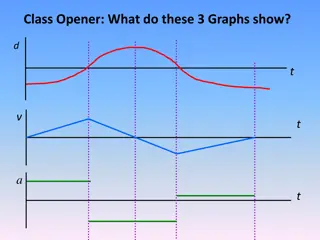
Understanding Gradients and Velocity-Time Graphs
Explore the concepts of gradients in linear graphs and velocity-time graphs, including calculations of acceleration, deceleration, and distance traveled. Learn the difference between speed and velocity, and understand the units of speed and acceleration.

Download Presentation

Please find below an Image/Link to download the presentation.
The content on the website is provided AS IS for your information and personal use only. It may not be sold, licensed, or shared on other websites without obtaining consent from the author. If you encounter any issues during the download, it is possible that the publisher has removed the file from their server.
You are allowed to download the files provided on this website for personal or commercial use, subject to the condition that they are used lawfully. All files are the property of their respective owners.
The content on the website is provided AS IS for your information and personal use only. It may not be sold, licensed, or shared on other websites without obtaining consent from the author.
E N D
Presentation Transcript
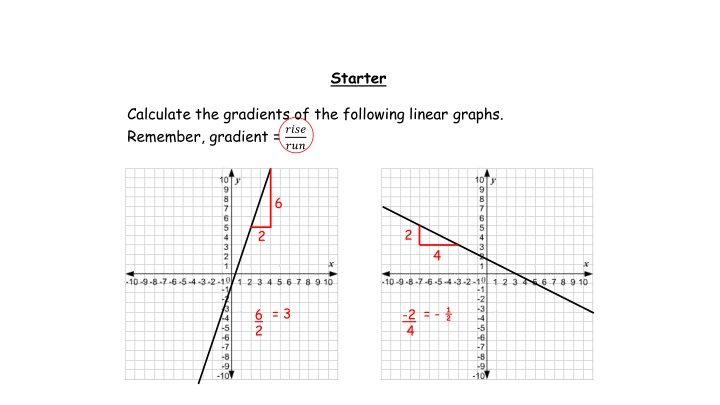
Starter Calculate the gradients of the following linear graphs. Remember, gradient = ???? ??? 6 2 2 4 = 3 = - 6 2 -2 4
Definitions Velocity Acceleration Deceleration speed with direction increasing velocity decreasing velocity Recap a h h h b b b Area of triangle = x b x h Area of trapezium = h (a + b)
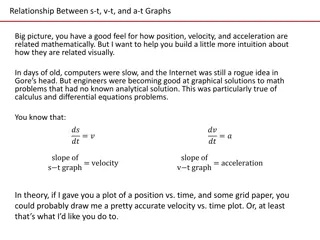
Gradients In general, the gradient of a line tells you the rate of change of the ?-variable in relation to the rate of change of the ?-variable Gradient = Acceleration (in m/s2) Gradient = Change in money over time (in /year) Gradient = Speed or Velocity (in m/s)
Area Under the Graph In general, the area under the graph tells you the product of the two units on the two axes Area = ?3 = ?3 Area = ? = metres i.e. distance! ? ? ? ? i.e. volume of water!
Velocity-Time Graphs For a velocity-time graph: Gradient = acceleration Area = distance travelled a) What was the acceleration in the first 4 seconds? rise run 4 = 8 = 2 m/s b) How far was travelled in the first 10 seconds? Area of triangle = x base x height Area of rectangle = base x height Total area = 16 + 48 = 64 m = x 4 x 8 = 16 m = 6 x 8 = 48 m
Velocity-Time Graphs The graph on the right shows the speed of a car approaching some traffic lights. a) What is happening between 4 and 8 seconds? Deceleration b) Calculate the rate of deceleration between 4 and 8 seconds. State your units in your answer. rise run 4 = -10 = 2.5 m/s c) Calculate the distance travelled. Area of rectangle = base x height = 4 x 10 = 40 m Area of triangle = x base x height Total area = 40 + 20 = 60 m = x 4 x 10 = 20 m
Velocity-Time Graphs The graph on the right shows the speed of a train for part of its journey. a) What is happening between 0 and 3 seconds? Constant speed b) Calculate the rate of acceleration between 3 and 5 seconds. State your units in your answer. rise run 2 (seconds) = 3 = 1.5 min/s 3 x 2 = 6 m 3 x 5 = 15 m c) Calculate the distance travelled. Area of trapezium = (a + b) h = x (2 + 5) x 2 = 7 m Total area = 6 + 15 + 7 = 28 m
What is the difference between speed and velocity? What are the units of speed and acceleration? How do you calculate acceleration from a velocity-time graph? How to you calculate distance travelled from a velocity-time graph?
Answers 1a. b. 0.6 m/s 50 m 5a. b. 2 m/s 9 + 30 = 39 m 2a. b. 0.3 m/s 58.5 m 6a. b. 1 m/s 21 + 4.5 = 25.5 m 3a. b. 1 m/s 18 + 24 = 42 m 7a. b. 3 m/s 10 + 10 + 8 = 28 m 4a. b. 3 m/s 54 + 13.5 = 67.5 m 8a. b. 3.5 m/s 20 + 28.5 + 16 + 7 = 71.5 m